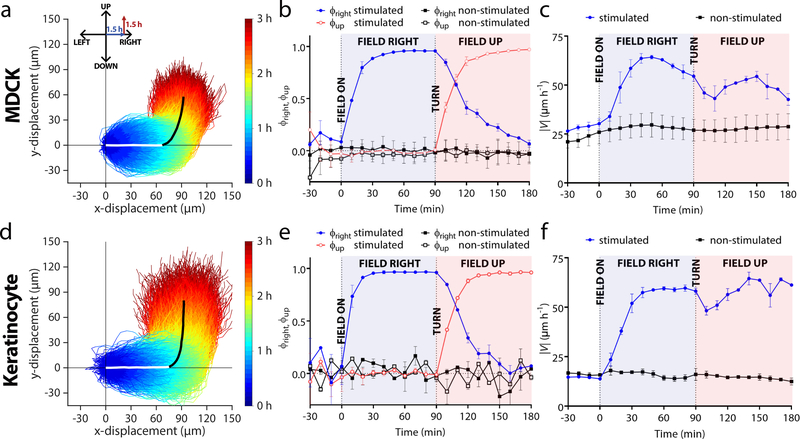
Figure 2.
Validating 2-axis control of collective cell migration with a demonstration of collective 90° turns in monolayers of either MDCK cells or keratinocytes (trajectories measured from n = 2 monolayers of each cell type). (a,d) Temporal color-coded trajectories of individually tracked MDCKs (a, n = 4,086 trajectories) or keratinocytes (d, n = 2,642 trajectories) stimulated for 1.5 h ‘right’, and then 1.5 h ‘up’. For visual clarity, trajectories within one standard deviation of the mean trajectory (bold white and black overlaid lines indicating the two phases of the turn) are selected and plotted.. Individual trajectories were taken from 2×2 mm central segments of 5×5 mm tissues during induced migration. (b,e) Mean directional order parameter both in the horizontal (blue) and vertical (red) axis during a turn for MDCKs (b) or keratinocytes (e). Data are plotted in 10 min intervals and represent the PIV-derived order averaged across tissues (n = 2). Error bars represent standard deviation across tissues. Dashed vertical lines denote when the field was switched on or changed direction. (c,f) Mean velocity in the analysis region for MDCKs (c) or keratinocytes (f). Error bars represent the standard deviation across tissues.

