Figure 3.
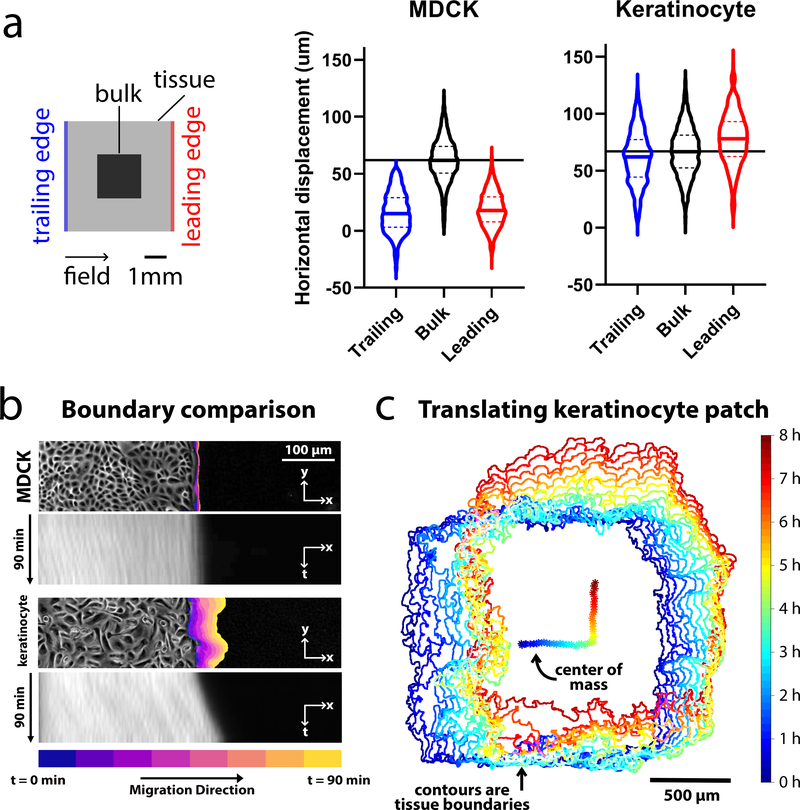
Comparing edge and bulk behavior during electrotaxis. We compared MDCK and keratinocyte monolayer electrotaxis during 90 min of single-axis stimulation. The electric field was directed ‘right’ for 1.5 h, then ‘up’ for 1.5 h. Data were analyzed from the 2×2 mm central segments of 5×5 mm tissues. (a) Visualization of the mean trajectory overshoot from the ideal trajectory (green) of the MDCK (blue) and keratinocyte (red) tissues. Trajectories averaged across n = 2 tissues for each cell type (4,086 MDCK trajectories and 2,642 keratinocyte trajectories). (b) Comparison of the overshoot, response time, relaxation time and turn time. Data plotted are the same as from panel (a), with least-squares fit lines overlaid. (c) Boundary displacement and kymographs for MDCK and keratinocyte tissues during the 90 min stimulation to the right. Boundary displacement plots visually indicate extent of outgrowth while the kymographs depict the average edge outgrowth across the entire leading edge of representative tissues. (d) Boundary displacement and tracking of the ensemble center of mass of a keratinocyte monolayer over an 8 h run, with 4 h stimulation in the ‘right’ and 4 h ‘up’. Related to Supplemental Movies 1–3.

