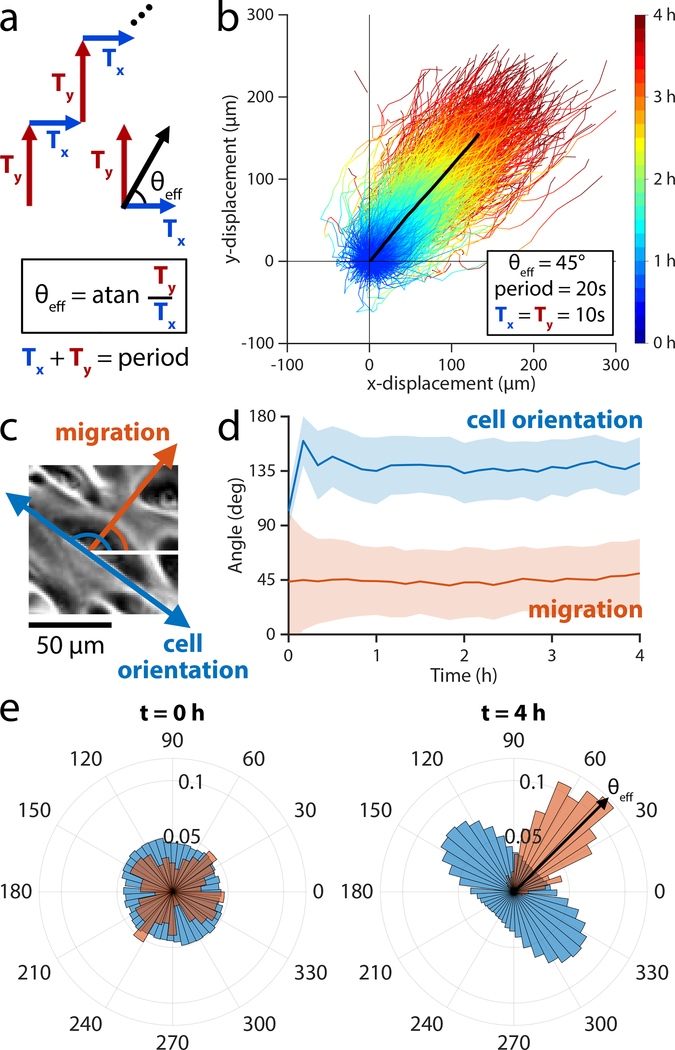
Figure 4.
Developing a universal migration control scheme based on rapid switching of electric field directions to enable arbitrary field angles. (a) The stimulation sequence divides a 20 sec stimulation window into two periods: horizontal stimulation (Ty) and vertical stimulation (Ty). The ratio of Ty/Tx determines the effective stimulation angle that the cells experience. (b) Trajectories of 2×2 mm central segments from keratinocyte ensembles across 4 h of stimulation with θeff = 45° (n = 2 ensembles). The mean trajectory is plotted as a thick black line and followed a migration angle of 44°. Tracks within two standard deviations of the mean cell trajectory are selected and plotted as time-coded multicolor lines (n = 900 trajectories). (c) Phase contrast image of keratinocyte cell migrating at ~45° (red arrow), showing the cell body oriented along ~135° (blue arrow). (d) Dominant orientation angle as computed by Fourier components analysis (blue) shows a rapid orientation to an average of 135° ± 20° throughout stimulation. Migration angle (red) averages 44° ± 32° throughout stimulation. Shaded bars represent standard deviation in orientation across one representative ensemble. (e) Cell body orientation (blue) and migration direction (red) histograms for a representative monolayer at t = 0 min, just as stimulation began, and at t = 240 min, just as stimulation ended. Cell body orientation ranges from 0° to 180° and its distribution is duplicated across the horizontal for visualization purposes. Cells in this representative monolayer averaged an orientation of 136° ± 20° and migration direction of 50° ± 28° just as stimulation ended. The cells across the ensemble oriented perpendicularly to the migration direction of 45°. Relate to Supplemental Movies 4,5.

