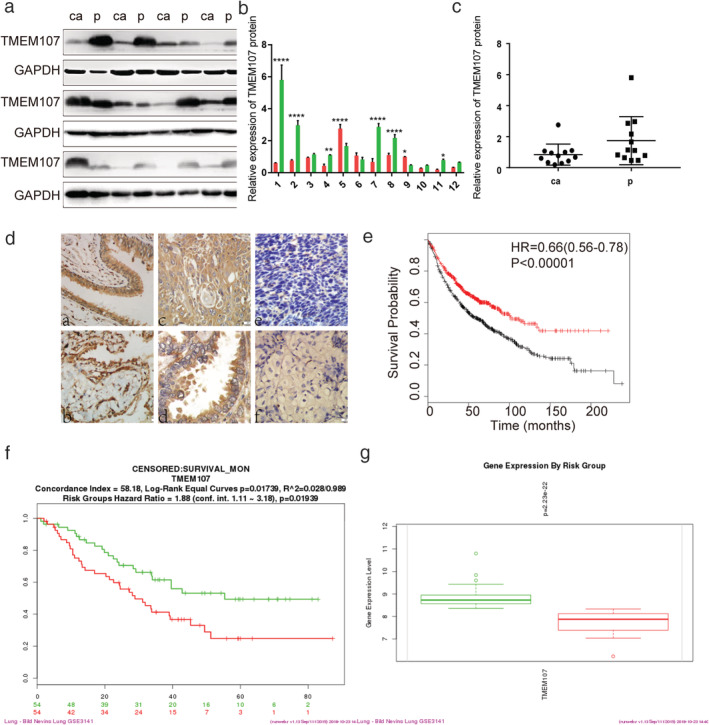
Figure 2.

TMEM107 expression is lower in NSCLC tissues and correlates with poor prognosis. (a) TMEM107 protein levels in 12 pairs of NSCLC and adjacent tissues. (b, c) Densitometric quantification of western blot results. *P < 0.05, **P < 0.01, ****P < 0.0001. (d) TMEM107 expression analyzed by immunohistochemistry in (a) healthy bronchial epithelial cells and (b) alveolar (c) well‐differentiated squamous cell carcinoma and (d) adenocarcinoma, and (e) poorly differentiated squamous cell carcinoma and (f) adenocarcinoma. (400×). (e) The prognostic value of TMEM107 tested with the Kaplan‐Meier plotter. Hazard ratio (HR), 95% confidence interval (CI) and P‐value are indicated. (f, g) The prognostic value of TMEM107 via the SurvExpress. (f) The survival analysis between low risk (green) and high risk (red) groups. (g) TMEM107 expression is lower in the high risk group than in the low risk group. (b) ( ) ca, (
 ) p; (c) (
 ) ca, (
 ) p; (e) (
 ) low, (
 ) high; (f) (
 ) 54, +:31, CI = 55.5, (
 ) 54, +:19, CI = 47.1; (g) (
 ) 2‐Low Risk, (
 ) 2‐High Risk
