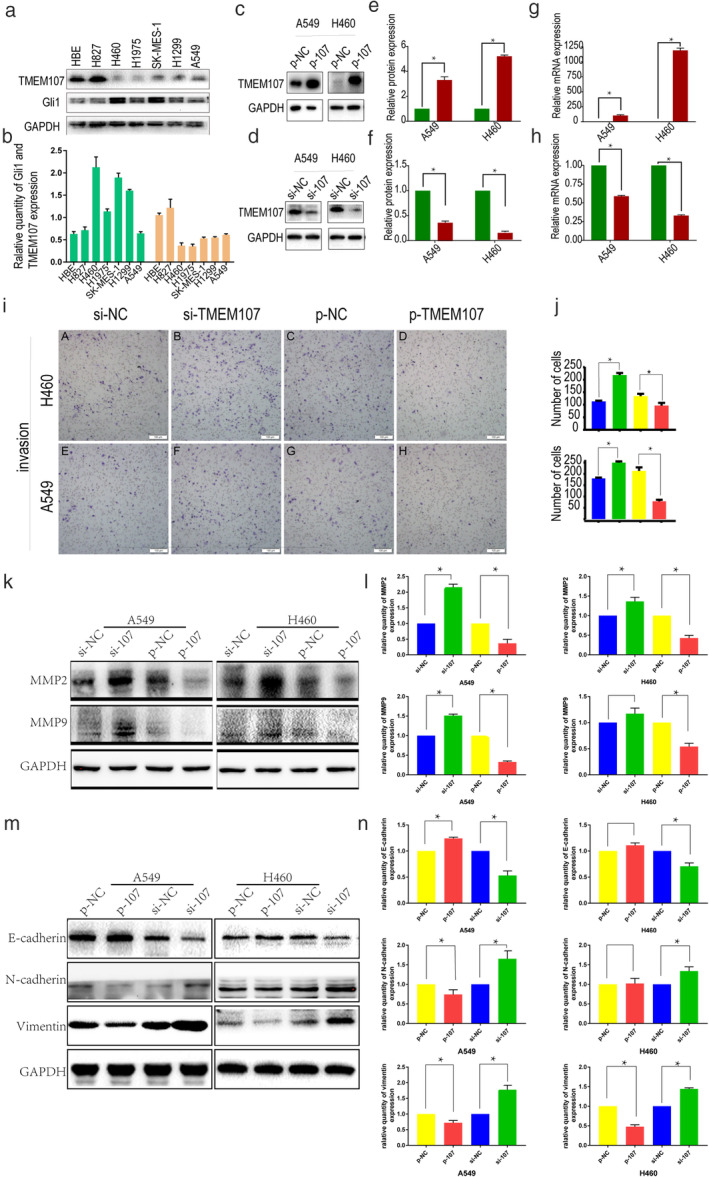
Figure 3.

TMEM107 inhibits invasion and EMT of NSCLC cells. (a) TMEM107 and Gli1 levels in HBE cells and six NSCLC cell lines determined by western blot analysis. (b) Densitometric quantification of western blot results. (c) Western blot analysis of transfection efficiency and (d) knockdown efficiency of TMEM107 in A549 and H460 cells (e, f) Densitometric quantification of western blot results from c and d, respectively. (g, h) q‐RT‐PCR assay for transfection efficiency. (i) Transwell assay to assess cell invasion after TMEM107 knockdown and overexpression. (j) The histogram of the number of cells invaded. (k) Expression of invasion‐related proteins after TMEM107 downregulation and overexpression. (l) Densitometric quantification of western blot results from (k). (m) Expression of EMT‐related proteins after TMEM107 upregulation and downregulation. (n) Densitometric quantification of western blot results from (m) (*P < 0.05). (b) ( ) TMEM107, (
 ) Gli1; (e) (
 ) p‐NC, (
 ) p‐107; (f) (
 ) Si‐NC, (
 ) Si‐107; (g) (
 ) p‐NC, (
 ) p‐107; (h) (
 ) Si‐NC, (
 ) Si‐107; (j) (
 ) si‐NC, (
 ) si‐TMEM107; (
 ) p‐NC, (
 ) p‐TMEM107
