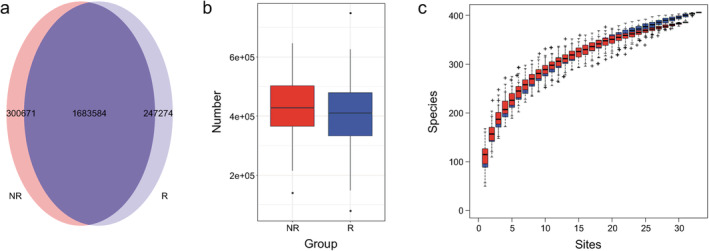
Figure 1.

The number of sequenced genes and species accumulation curve in responders and nonresponders. The Wayne diagram shows the nonredundant metagenomic gene catalogues constructed by high quality reads in the responder and nonresponder groups, presented in (a) a pie chart and (b) a box comparison chart  , NR;
, NR;  , R. (c) Species accumulation curve, with a tendency to gradually flatten out, was projected using vegan in R programming language
  , R;
, R;  , NR.
, NR.
