
Figure 5.
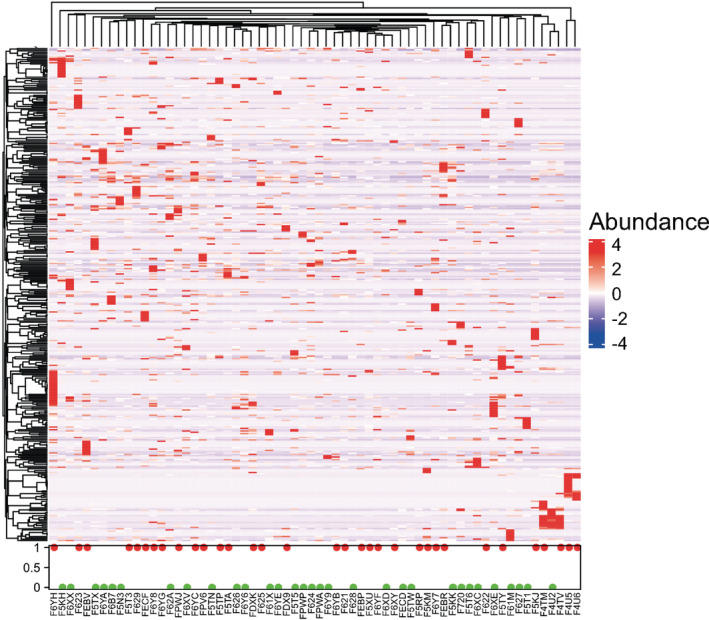
Heatmap of species differences between individuals based on unsupervised hierarchical clustering. Unsupervised hierarchical clustering was applied to draw the heatmap, with red, blue, and white indicating enrichment, reduction, and no correlation, respectively, which showed the microbial species abundance was different between the responders (Effect = 1, red dot) and nonresponders (Effect = 0, green dot). Color of boxes indicates relative abundance, and darker colors indicate greater abundance  , 1(red): R;
  , 0(green): NR.