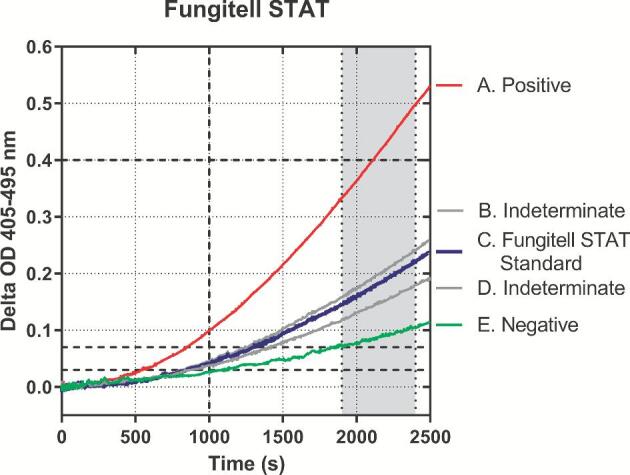
Figure 1.

Illustration of kinetic curves derived from the Fungitell STAT™ method. Samples on the graph: (A) is positive, and (B) and (D) are indeterminate. (C) Fungitell STAT™ Standard; (E) negative. All plots are delta OD 405-495 nm. The gray zone between 1900 and 2400 seconds is the area of linear regression from which rates are determined. The dashed lines on the y-axis are 0.03, 0.07, and 0.40 delta OD 405-495 nm, respectively. The dashed line on the x-axis is at 1000 seconds. These markings relate to the QC criteria described in Supplementary File 1. The reduced data output from these kinetic curves is presented in Table 1.
