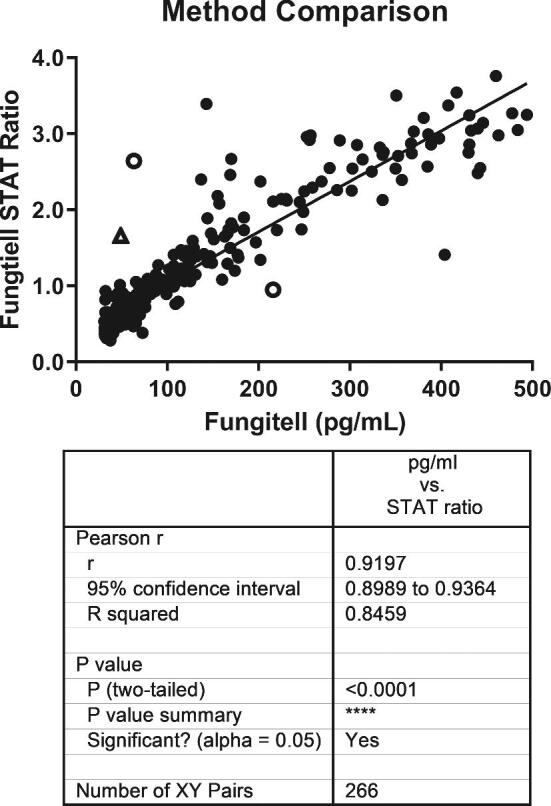
Figure 3.

Comparison of Fungitell STAT™ with Fungitell® predicate. The Fungitell STAT™ ratio data and the Fungitell® concentration data for 266 samples were used for this analysis. These 266 samples were those from the population of 488 (see method comparison section) that produced within range, numerical results for both methods. Values that were under- or over-range in either assay were not included in the assessment. Among several discrepant replicates observed three samples of the 266 produced highly discrepant results relative to both the correlation and interpretative zones between the two methods. Two of these were indeterminate to positive or positive to indeterminate transitions (open circles). One (open triangle) was a negative to positive transition. This sample was retested and found to be negative as expected. Contamination is suspected in the initial testing of that sample.
