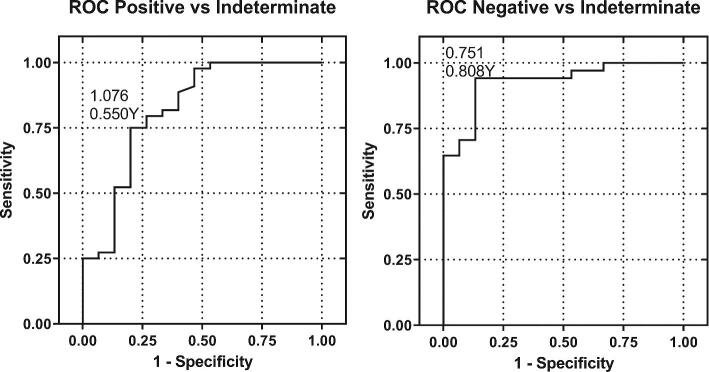
Figure 4.
ROC Curves. Diagnostic performance evaluation included the determination of the sensitivity and specificity of correct sample categorization at the boundaries of adjacent categories: Negative to indeterminate and positive to indeterminate. The sensitivity and 1-specificity were calculated and plotted as shown above. In addition, the Youden index was calculated and used to determine the cutoffs. The ROC assessment method followed the guidance document: CLSI EP24-A2: Assessment of Diagnostic Accuracy of Laboratory Tests Using Receiver Operating Characteristic Curves Approved Guideline-Second Edition. The sensitivity and specificity for the discrimination of negatives and positives were 94% and 75%, respectively.

