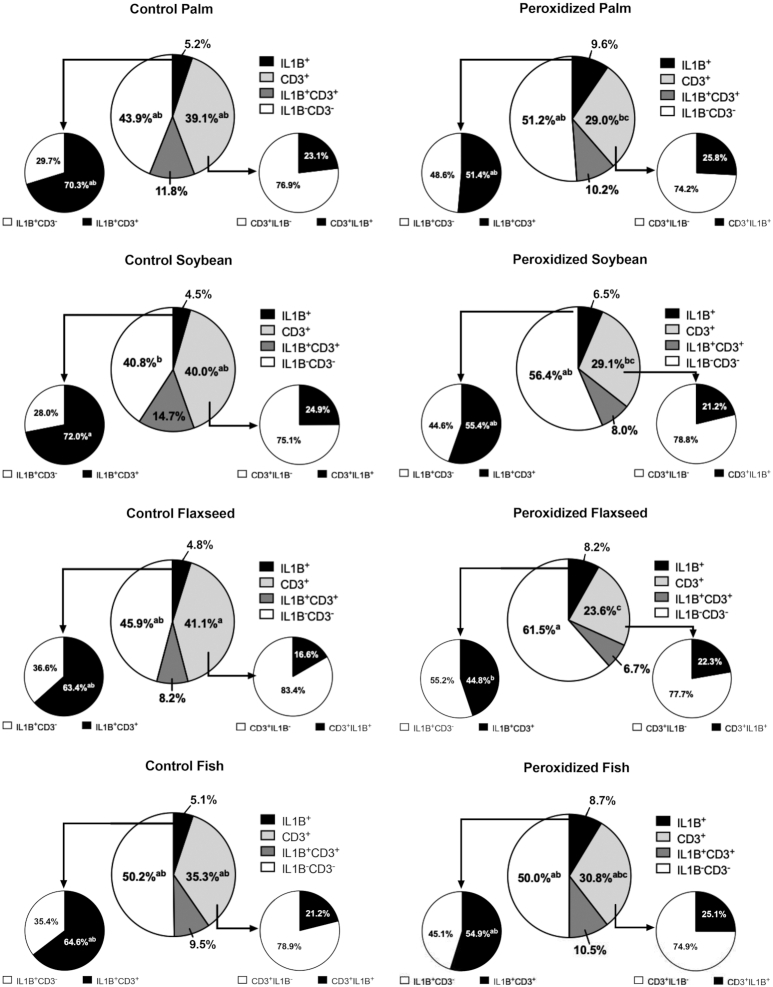
FIGURE 5.
Percentages of IL1B+, CD3+, IL1B+CD3+, and IL1B−CD3− cells in the ileum of broiler chickens fed fresh or peroxidized palm, soybean, flaxseed, or fish oils. The percentage of cells positive for the IL1B probe that were also CD3+ are represented by the pie chart connected to the IL1B+ slice. Likewise, the percentage of cells positive for the CD3 probe that were also IL1B+ are represented by the pie chart connected to the CD3+ slice. Data represent the mean percentage of cells positive for IL1B or CD3, n = 2 birds (6 scanned fields per bird). All cell populations within each treatment are presented for clarity. Due to the complex nature of this presentation, statistical comparison of each cell population is made between treatments rather than within treatment. As such, different superscripts within the same cell population (i.e., the same-colored slice between treatments) indicate significant differences, P ≤ 0.05.

