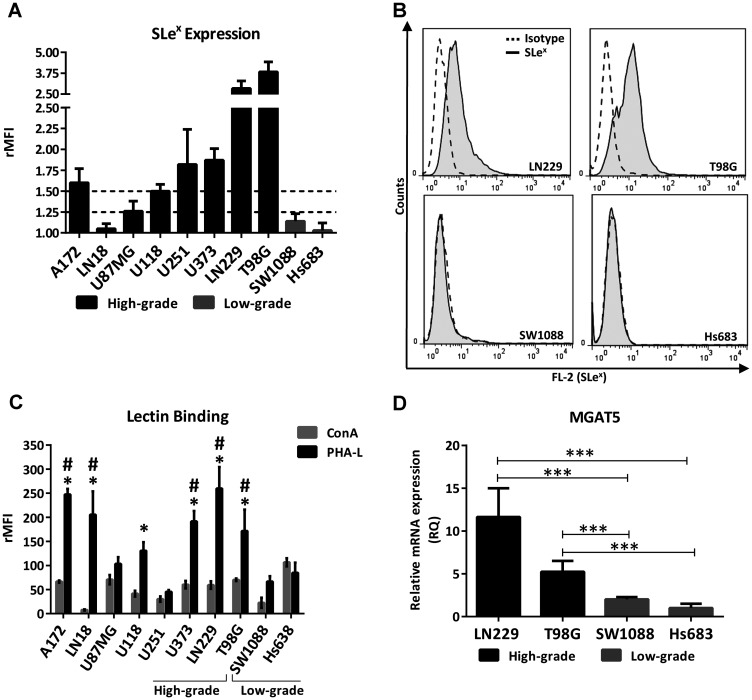
Figure 1. Glycophenotype characterization in high- and low-grade glioma cell lines.
(A) SLex expression of high- and low-grade glioma cell lines evaluated by flow cytometry. Doted lines represent limits between low, medium and high expression. High expression was considered greater than 1.5 rMFI, medium between 1.25 and 1.5 rMFI, and low as lower than 1.25 rMFI. Data represent means ± S.D (rMFI) of three independent experiments. (B) Representative experiment for Slex expression. (C) Comparison of cell binding to lectins ConA and PHA-L by flow cytometry. ConA vs PHA-L: p < 0.05, T Test for A172, LN18, LN229, U118, U373 and T98G. PHA-L binding comparison against SW1088, * p < 0.05, T Test. PHA-L binding comparison against Hs683, # p < 0.05, T Test. (D) Relative comparison of MGAT5 transcripts levels between high- (LN229, T98G) and low-grade (SW1088, Hs683) glioma cell lines by qRT-PCR. Hs683 cell line was used as the reference sample (*** p < 0.001, ANOVA followed by Tukey’s multiple comparisons test).

