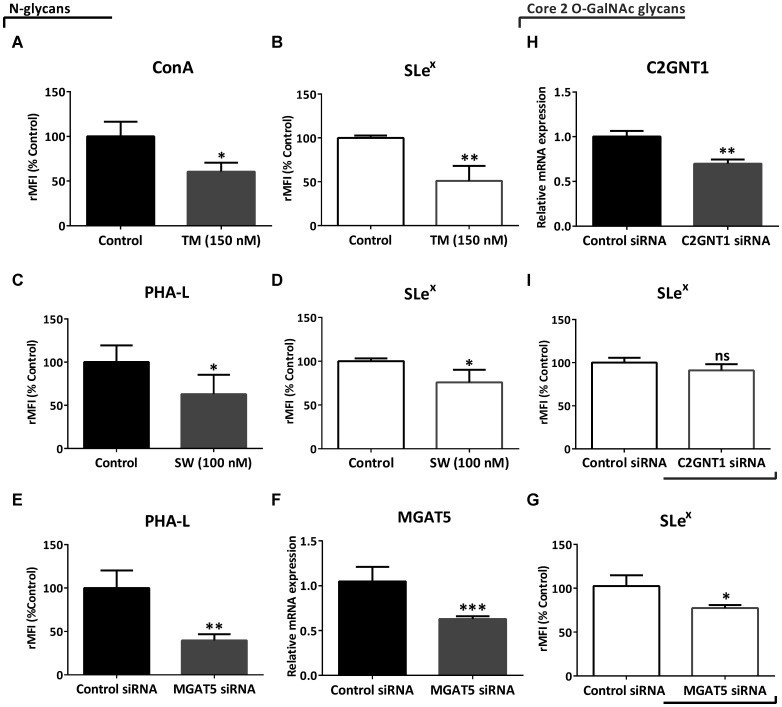
Figure 3. Evaluation of SLex expression under downmodulation of N- and core 2 O-GalNAc glycans in the high-grade glioma cell line LN229 by flow cytometry.
(A) ConA binding and (B) expression of SLex after treatment with 150 nM TM for 24 h. (C) PHA-L binding and (D) expression of SLex after treatment with 100 nM SW for 24 h. (E) PHA-L binding, (F) MGAT5 transcripts levels and (G) expression of SLex after 48 h of MGAT5 or control siRNA transfection. (H) C2GNT1 transcripts levels and (I) expression of SLex after 48 h of C2GNT1 or control siRNA transfection. Data represent means ± S.D. of three independent experiments. (A, C, E, F, H and I) T Test. (B, D, G) Mann–Whitney. * p < 0.05, ** p < 0.01, *** p < 0.001.

