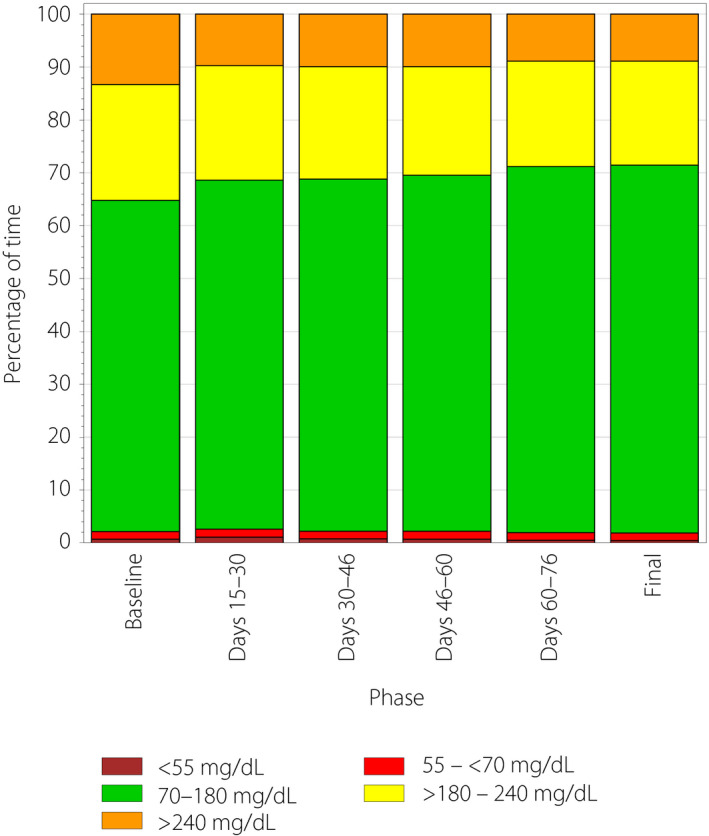
Figure 2.

Time spent in each glycemic range by study phase. The colored bars show the average hours per day spent <55 mg/dL (brown), 55 to <70 mg/dL (red), 70–180 mg/dL (green), >180 to 240 mg/dL (yellow) and >240 mg/dL (orange) during each 2‐week phase of the 90‐day study.
