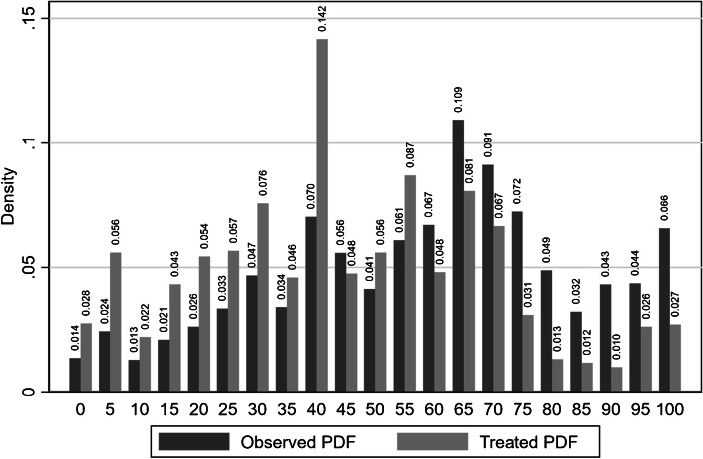
Fig. 2.
Distribution of financial wellbeing (FWB): observed and treated (any COVID-19 shock). Note: The graph compares the observed probability density function (PDF) of financial wellbeing (dark grey bars) to that of the “treated” subpopulation of those who have experienced any COVID-19 shocks (light grey bars), as factually observed. All statistics are Census population weighted for representativity. N = 2078

