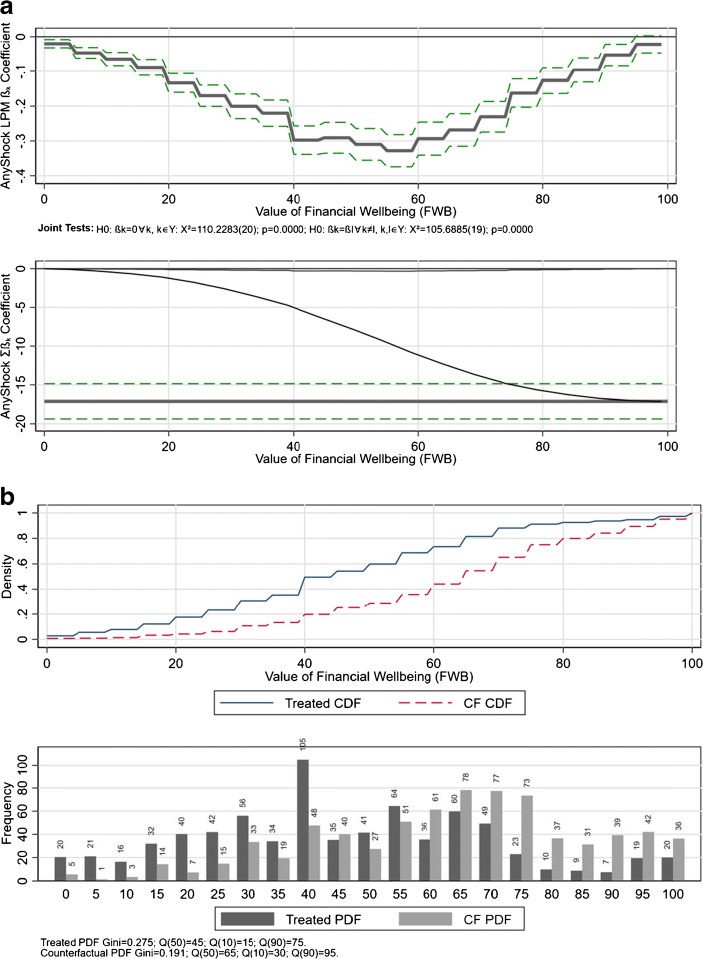
Fig. 3.
Distribution regression: any COVID-19 shock. a Any shock β over distribution of FWB. b Any shock CDF and PDF over FWB. Note: The top panel of a displays the individual distribution regressions (linear probability models or LPM) at every point in the financial wellbeing distribution. The point estimate is given by the dark black line and the respective 95% confidence interval by the surrounding dashed green lines. The summation of these individual associations over the entire distribution gives exactly the overall OLS coefficient, shown in the bottom panel of a (bold black line with dashed green line showing the 95% confidence interval). As the association with any COVID-19-related labour market shock (AnyShock) is negative, the negative association is summed up (the curved light black line) over the entire distribution of financial wellbeing and exactly equals the value of the estimated OLS coefficient. The “step function” appearance of the estimated coefficients in the top panel comes from the fact that there are at most 21 distinct values in the 0 through 100 scale (0, 5, 10, 15, …, 100). The top panel of b shows for the group of people experiencing any COVID-19-related labour market shock (AnyShock) the observed cumulative density function (CDF) over the distribution of financial wellbeing (solid blue line). Using the coefficients of the distribution regression estimations, the association of AnyShock with financial wellbeing is removed, producing the counterfactual CDF shown in dashed red. The bottom panel displays the corresponding probability functions (PDF) as histograms. The dark bars display the values of financial wellbeing as observed for those experiencing AnyShock. The counterfactual histogram in lighter grey removes the association of AnyShock with financial wellbeing

