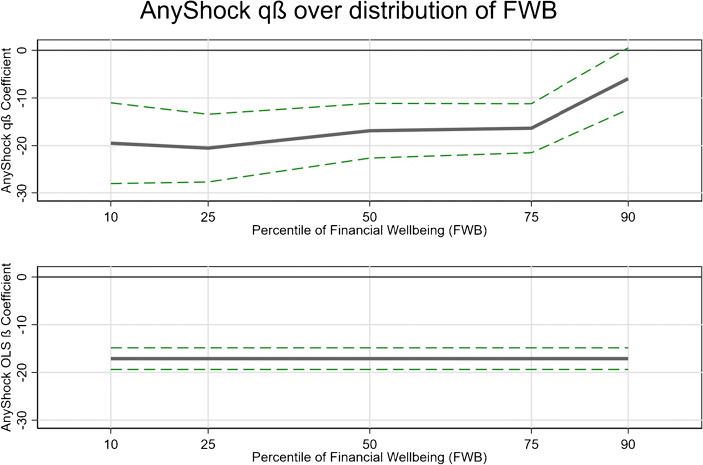
Fig. 5.
Unconditional quantile regression: Coefficients over financial wellbeing distribution. Note: The top panel shows the estimated regression coefficients (Table 1, panel 1C) of the unconditional quantile regression at various percentiles (10, 25, 50, 75 and 90) of the financial wellbeing distribution (black line). The point estimates are bounded in a 95% confidence interval (green dashed lines). For the unconditional quantile estimate to be relevant, there needs to be sufficient variation in the estimated coefficients over the distribution. Traditionally, one calculates inter-percentile ranges and tests for the significance of differences between the percentiles 90-10 or 75-25. The bottom panel shows the average OLS coefficient (− 17.1) which does not change over the distribution of financial wellbeing (black line). The quantile coefficient at the 25th percentile (− 20.6) is larger in absolute terms than the OLS estimate (− 17.1) and at the 90th percentile (− 5.9), the estimated (insignificant) coefficient is much lower

