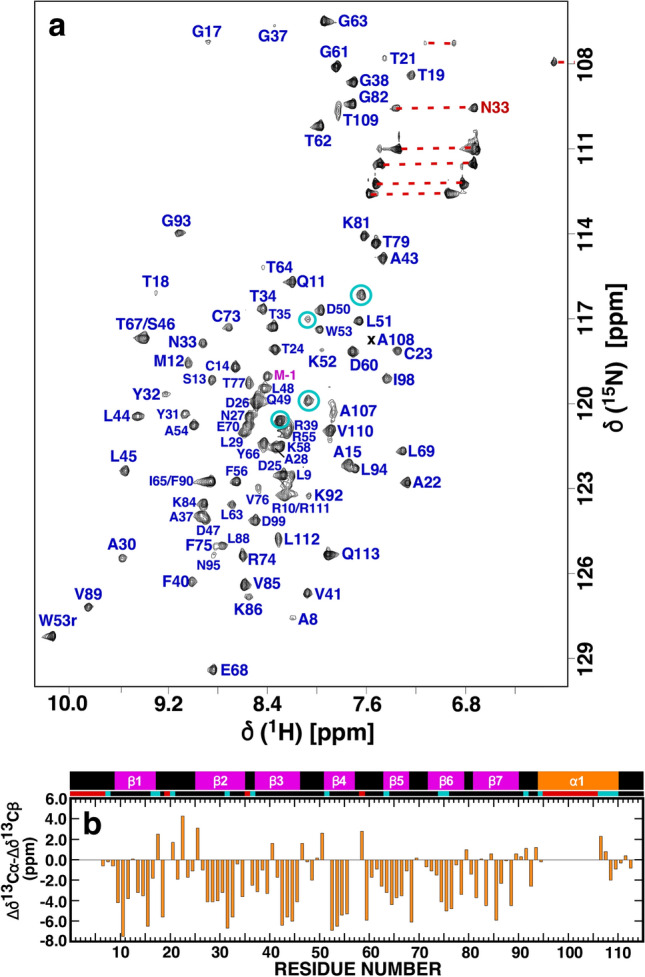
Fig. 1.

a Assigned 1H-15N HSQC spectrum of 15N-labelled Nsp9 (~ 0.5 mM) collected at a proton resonance frequency of 600 MHz, 303 K, in 100 mM NaCl, 20 mM Tris, 1 mM DTT, pH 7.0. Amide cross peaks for the three “scar” residues (G-3–M-1) and the 113-residue native protein (N1 - V113) are colored magenta and blue, respectively, with the side chain resonances identified with a red horizontal line. b Plot of the backbone combined Cα/Cβ chemical shift differences from random coil values, Δδ13Cα - Δδ13Cβ for SARS-CoV-2 Nsp9. On top of the plot is a schematic representation of the elements of secondary structure observed in the crystal of SARS-CoV-2 Nsp9 (PDB ID 6WXD): β-strands = magenta, α-helix = orange. Residues with missing or unassigned resonances in the 1H-15N HSQC spectrum of SARS-CoV-2 Nsp9 are identified with red blocks below scheme and residues with weak amide cross peak intensities relative to the majority of amide resonances are identified with cyan blocks
