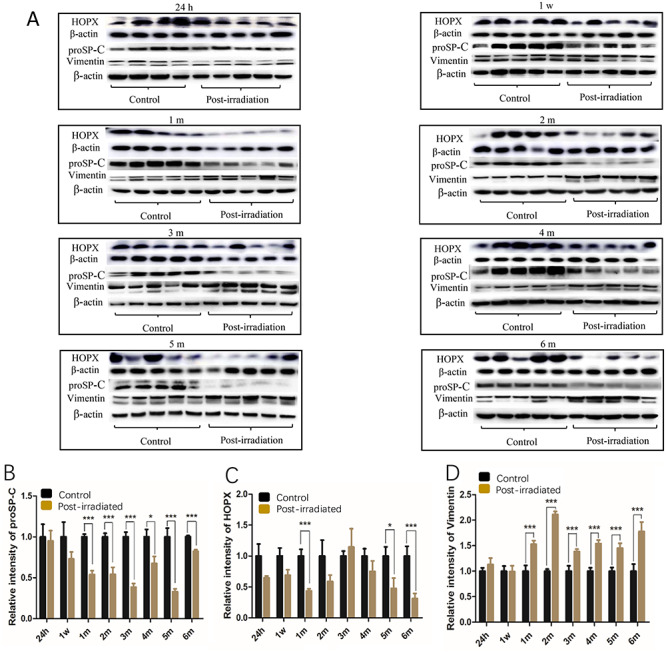
Fig. 4.

The expression of the pro-SP-C, HOPX and vimentin proteins in the mouse lungs at different phases of injury following irradiation. The relative levels of the proSP-C, HOPX and vimentin proteins were examined by western blot (A). Graphs (B), (C) and (D) show the relative levels of the three phenotype markers after exposure to IR. The relative amounts of proSP-C, HOPX and vimentin in the graphs were obtained by the ratios of the target protein pixels to the corresponding β-actin pixels. The data presented are shown as the mean ± SD. Statistical analyses between groups were performed using Student’s t-test. *P < 0.05, **P < 0.01, ***P < 0.001. h, hour; w, week; m, month. Note: The proSP-C and vimentin proteins were detected on the same blot membranes, and the western blots for HOPX were performed separately.
