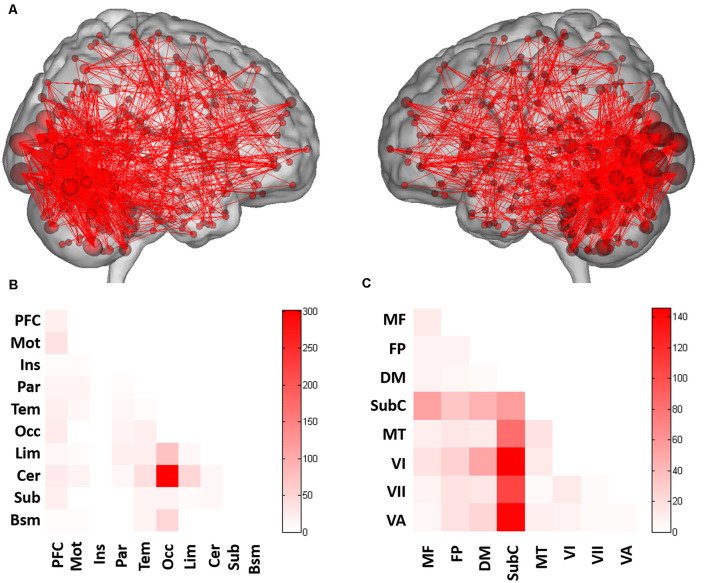
Figure 2.
Functional connections predicting CAPS-IV scores. (A) Positive (red) networks selected by the prediction model. For the positive network, increased edge weights (i.e., increased functional connectivity) predict higher CAPS-IV scores. (B) Connections plotted as number of edges within and between each pair of macroscale regions. (C) Connections plotted as number of edges within and between each pair of canonical networks. Cells represent the total number of edges connecting nodes within (and between) each macroscale region or canonical network, with darker colors indicating a greater number of edges. PFC, prefrontal; Mot, motor; Ins, insula; Par, parietal; Tem, temporal; Occ, occipital; Lim, limbic; Cer, cerebellum; Sub, subcortical; Bsm, brainstem; MF, medial frontal network; FP, frontoparietal network; DM, default mode network; SubC, subcortical-cerebellum network; MT, motor network; VI, visual I network; VII, visual II network; VA, visual association network.

