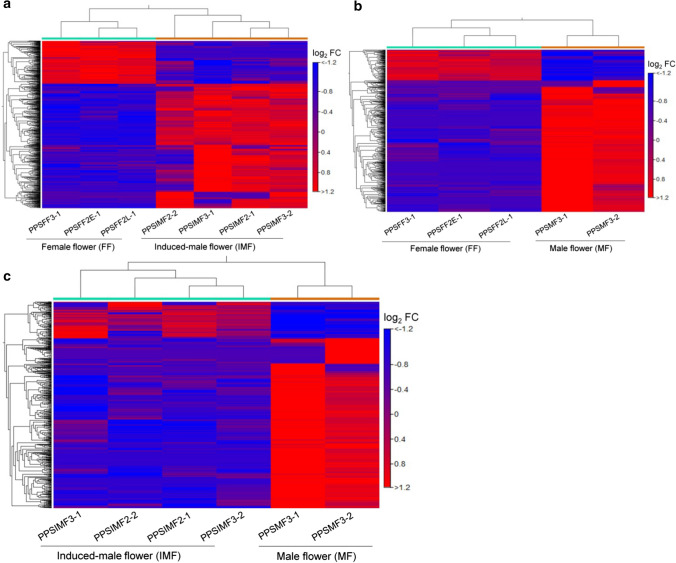
Fig. 2.
Hierarchical clustering of DEGs in different expression analysis assays. a IMFvsFF, b MFvsFF and c IMFvsMF libraries. Heatmaps show the relative expression levels of each transcript (row) in each flower sample (column). A comparable number of transcripts were differentially expressed in IMFvsFF (15%) and MFvsFF (17.6%) libraries, while slightly low numbers of DEGs (10%) were detected in IMFvsMF library, with the cut-off value of log2FC ≥ │1│and FDR ≤ 0.05. Expression values were normalized by RPKM and expressed as log2 fold change (log2FC), with a cut-off value of ≥ │1│and FDR p value ≤ 0.05. The color scale indicates upregulation (red) and downregulation (blue) of the transcripts in the samples

