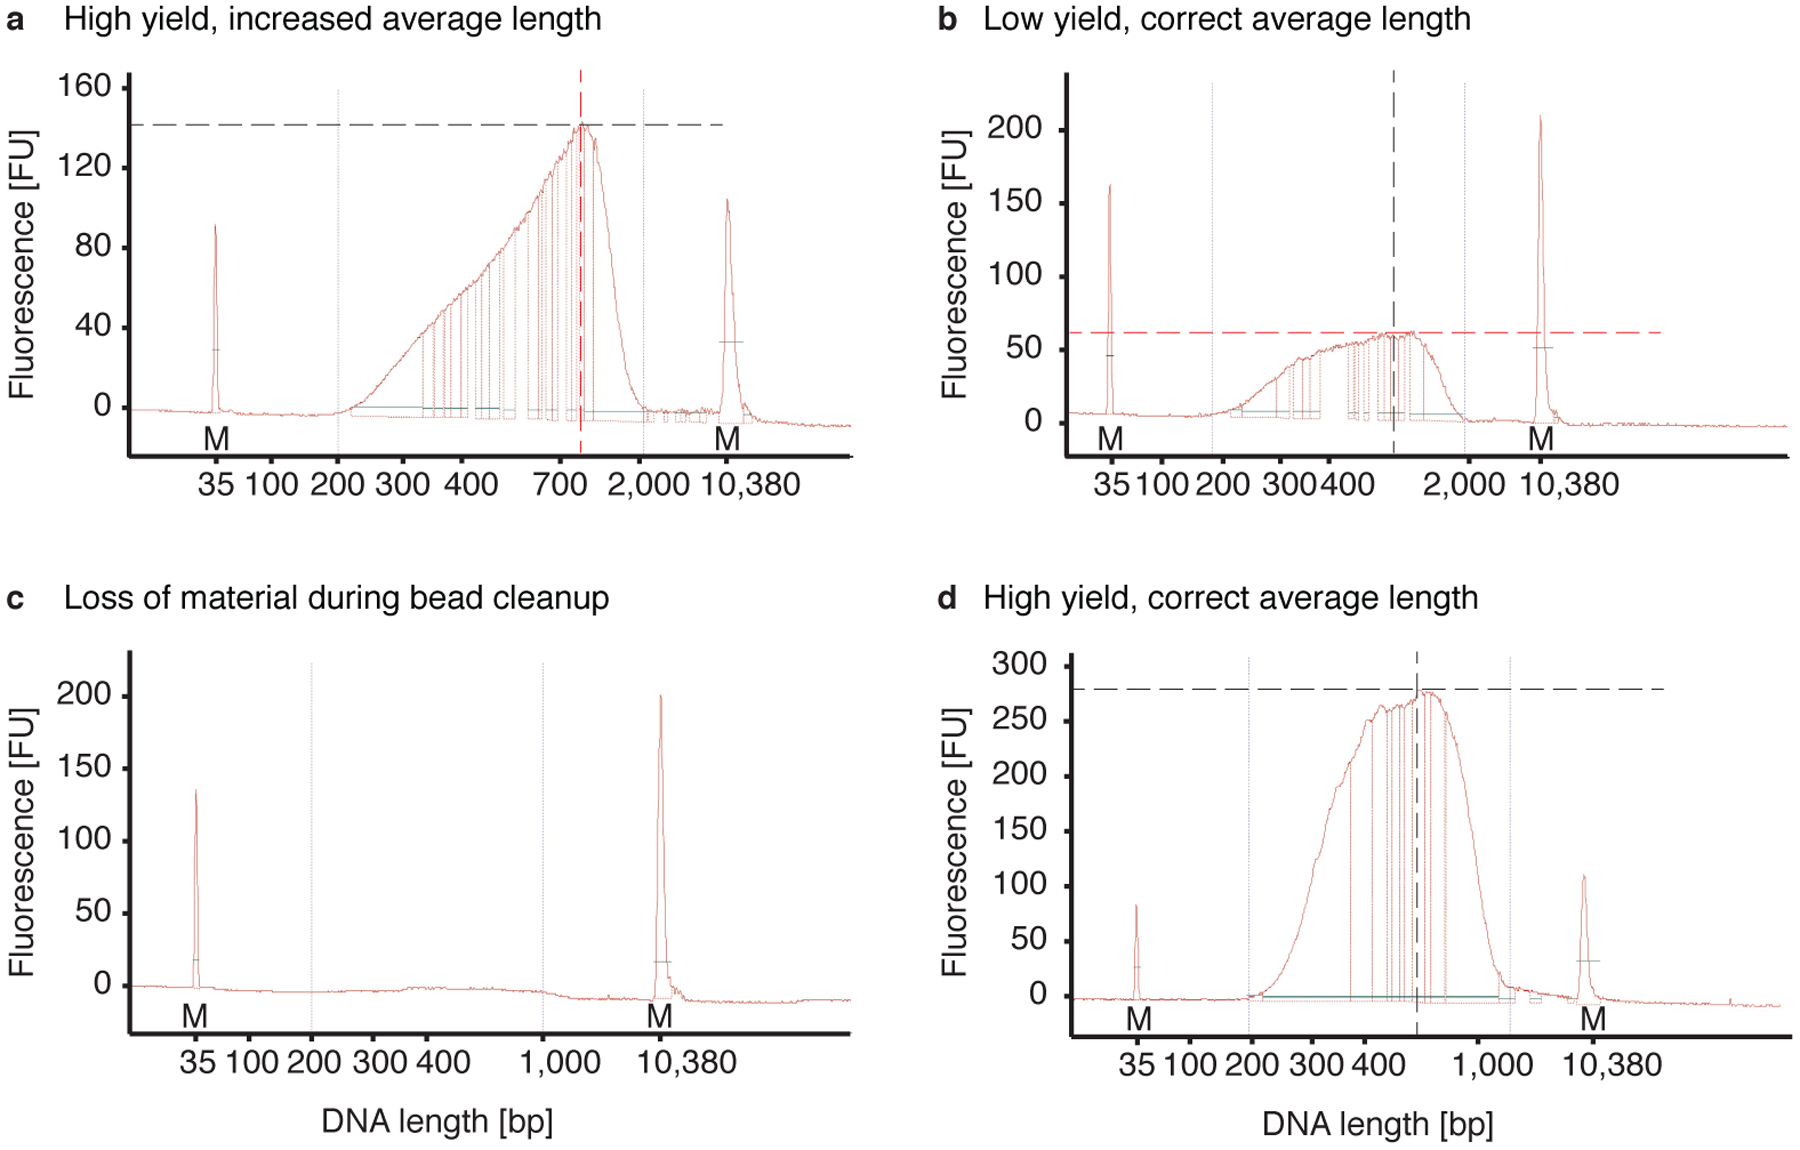
Fig 6 |. Examples of DNA bioanalyzer plots.

Bioanalyzer results after library construction: a) The library shows good yield (>150 FU) but size distribution is slightly increased (peaking at 1,000 – 1,500 nt), probably due to increased fragment length of aRNA. b) The library shows correct length distribution (250 – 900 nt) but low yield. If library was constructed from aRNA similar to example 4 from 3a, material was probably lost during bead purification. Repeat library preparation with leftover aRNA. c) Lack of both the adapter and the PCR product indicate complete loss during bead purification or failed library preparation. d) The library shows high yield >250 FU and correct size distribution of 250 – 700 nt. FU, fluorescence units. nt, nucleotides. Peaks marked with an “M” indicate the reference markers; black and red dashed lines indicate the relevant optimal and suboptimal features, respectively.
