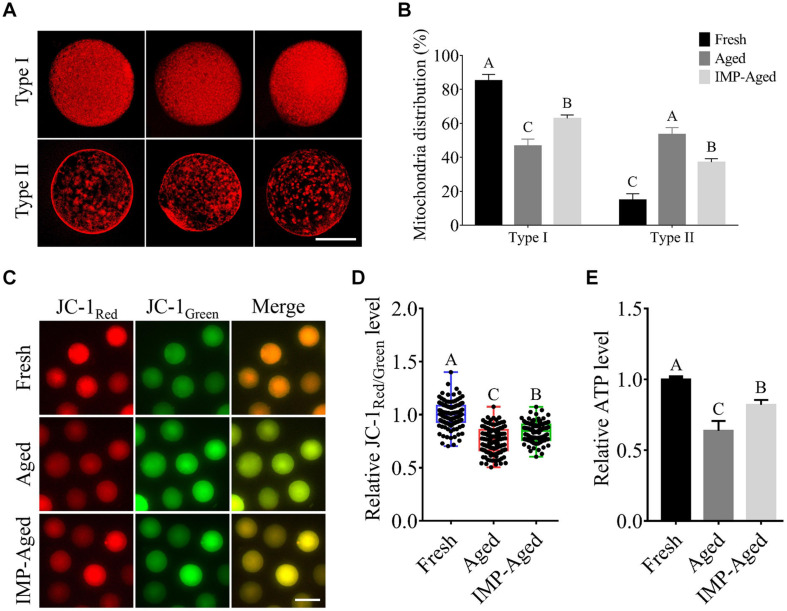
FIGURE 5.
Effects of IMP on mitochondrial distribution, ΔΨm, and ATP levels in aged oocytes. (A) Representative images of Type I/II (three each) mitochondrial distribution in oocytes with MitoTracker staining. Scale bar = 50 μm. (B) The proportion of Type I/II oocytes in fresh (N = 119), aged (N = 76), and IMP-treated aged (N = 99) groups. Significant differences are represented by different capital letters (P < 0.01). R = 3. (C) Representative images of JC-1Red/Green staining in fresh, aged, and IMP-treated aged oocytes. Scale bar = 100 μm. (D) Relative fluorescence intensity of JC-1Red/Green in fresh (N = 128), aged (N = 122), and IMP-treated aged (N = 120) oocytes. Significant differences are represented by different capital letters (P < 0.01). R = 3. (E) Relative ATP levels in fresh, aged, and IMP-treated aged oocytes. R = 3. Significant differences are represented by different capital letters (P < 0.01).

