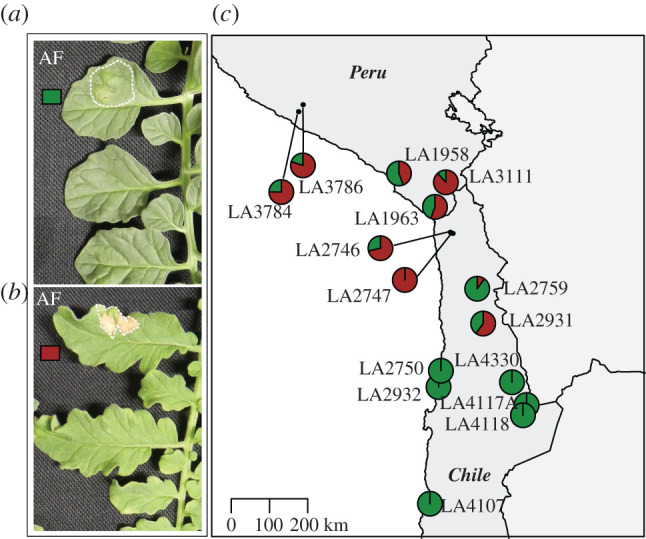
Figure 2.

Infiltration of AF in populations of S. chilense. Leaf of an individual plant with no recognition of components present in the infiltrated AF (a) and leaf of an individual plant recognizing at least one component present in the AF (b). The infiltrated areas are indicated with white dotted lines. The map on the right shows the geographical distribution of AF component perception in S. chilense. The map shows the geographically distinct populations of S. chilense and their response to infiltration with AF. Each pie chart indicates one population with 8 to 17 individuals (c). The brick red fraction represents plants that respond to C. fulvum AF, whereas green indicates the fraction of non-responding plants. (Online version in colour.)
