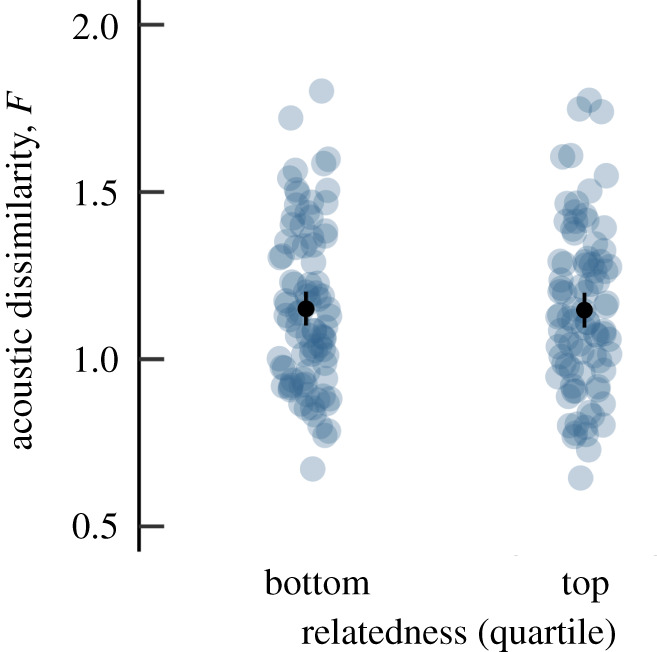
Figure 3.

Relation between acoustic dissimilarity and genetic relatedness (top and bottom quartiles of the Wang estimator W) for N = 175 dyads. Note that lower dissimilarity values indicate higher similarity. Light grey dots represent dyadic values, black dots the mean with 95% confidence interval. (Online version in colour.)
