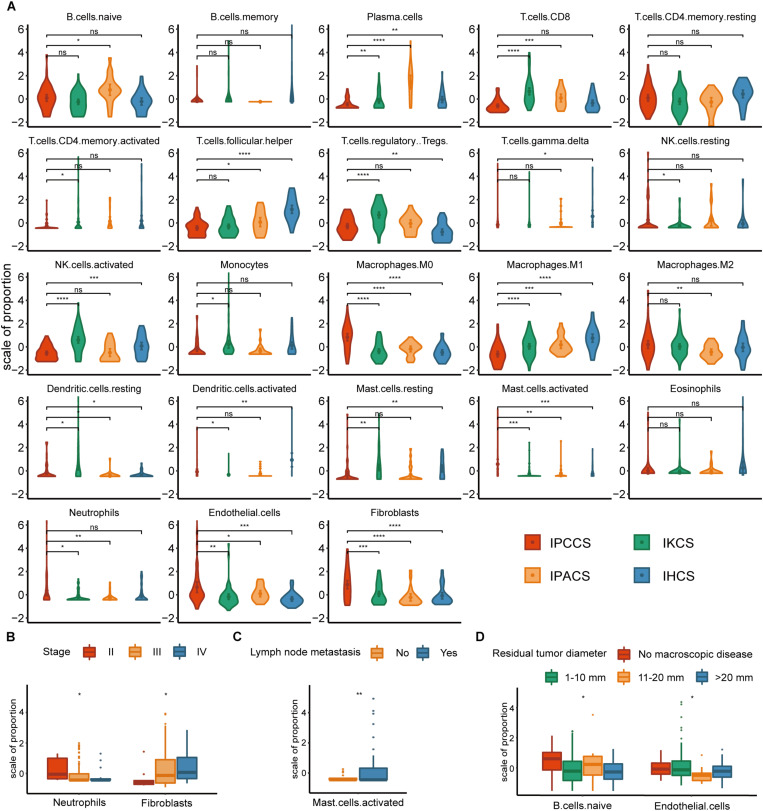
FIGURE 2.
The distribution of TME cells in four subtypes and different clinical features of OV. (A) The proportion of each TME cell type in four subtypes of OV. (B) The distribution of neutrophils and fibroblasts in stages II, III, and IV of OV. (C) The distribution of activated mast cells in the lymph node metastases of OV. (D) The distribution of naïve B cells and endothelial cells in various residual tumor diameter of OV (statistical comparison between the two groups was performed by Student’s t-test, and multivariate groups were compared by Kruskal-Wallis test. ns P > 0.05, *P < 0.05, **P < 0.01, ***P < 0.001, ****P < 0.0001).

