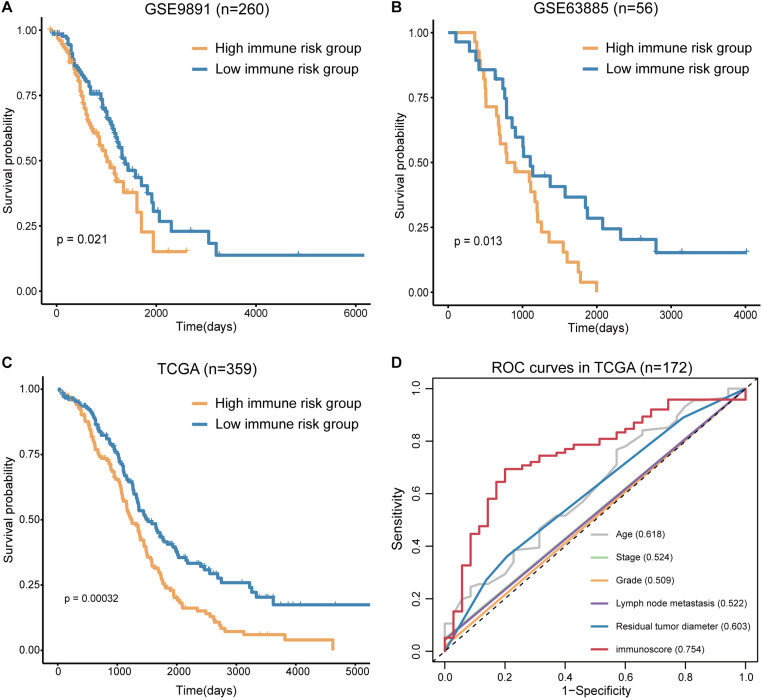
FIGURE 5.
Verification of the immunoscore in independent cohorts. (A) The survival curves of immunoscore in GSE9891. (B) The survival curves of immunoscore in GSE63885. (C) The survival curves of immunoscore in TCGA OV. (D) The ROC curves of the clinical features and immunoscore in TCGA OV (numbers after the clinical features and immunoscore represent the corresponding AUC).

