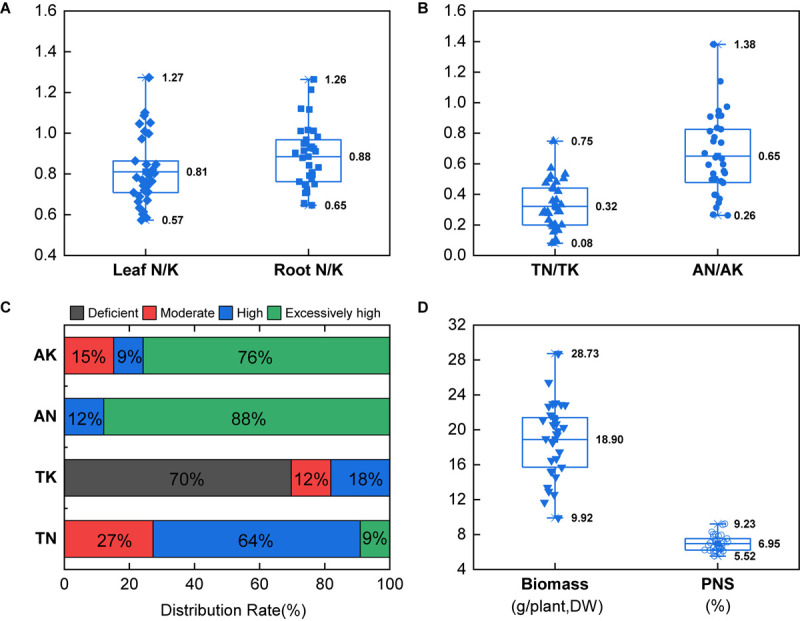
FIGURE 1.

Field investigation of the N/K values in plants (A) and soils (B), distribution of soil N and K (C), and biomass and P. notoginseng saponins (PNS) (D). The classification of soil nutrient was referred to the standard: TN < 1.0 g.kg–1 (deficient), 1.0 g.kg–1 ≤ TN < 1.0 g.kg–1 (moderate), 1.5 g.kg–1 ≤ TN < 2.0 g.kg–1 (high), TN ≥ 1.0 g.kg–1 (excessively high); AN < 90 mg.kg–1 (deficient), 90 mg.kg–1 ≤ AN < 120 mg.kg–1 (moderate), 120 mg.kg–1 ≤ AN < 150 mg.kg–1 (high), AN ≥ 150 mg.kg–1 (excessively high); TK < 15 g.kg–1 (deficient), 15 g.kg–1 ≤ TK < 20 g.kg–1 (moderate), 20 g.kg–1 ≤ TK < 25 g.kg–1 (high), TK ≥ 25 g.kg–1 (excessively high); AK < 100 mg.kg–1 (deficient), 100 mg.kg–1 ≤ AK < 150 mg.kg–1 (moderate), 150 mg.kg–1 ≤ AN < 200 mg.kg–1 (high), and AN ≥ 200 mg.kg–1 (excessively high). Boxplots center represents means; upper and lower represent 75 and 25% percentiles (n = 33). The error lines represent the maximum and minimum.
