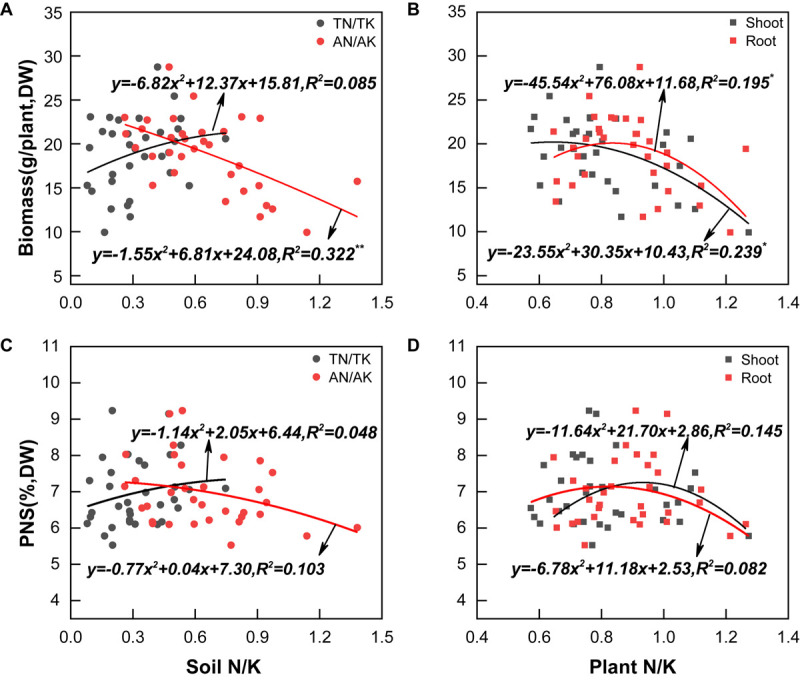
FIGURE 2.

Correlation of the cultivation soil N/K values (A,C), plants N/K values (B,D), biomass levels (A,B), and PNS (C,D). All data are fitted with a linear regression, n = 33. mean significant * and ** correlation at p < 0.05 and p < 0.01, respectively.
