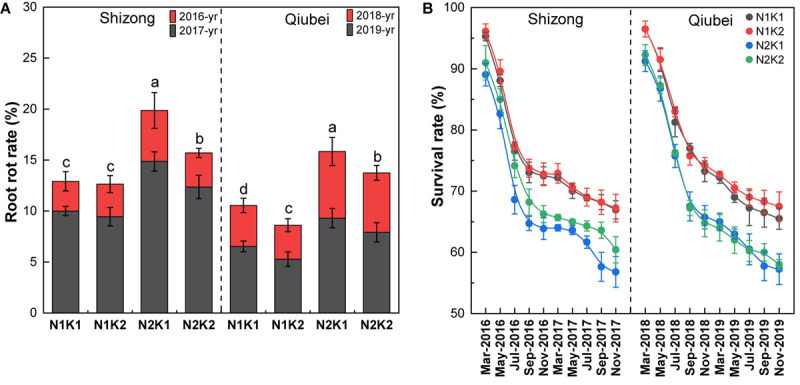
FIGURE 3.

The root rot rate (A) and survival rate changing (B) of P. notoginseng seedlings under the conditions of different N and K application ratios. All data represent means ± SDs, n = 4; different small letters above the column represent significant difference among the four treatments at p < 0.05.
