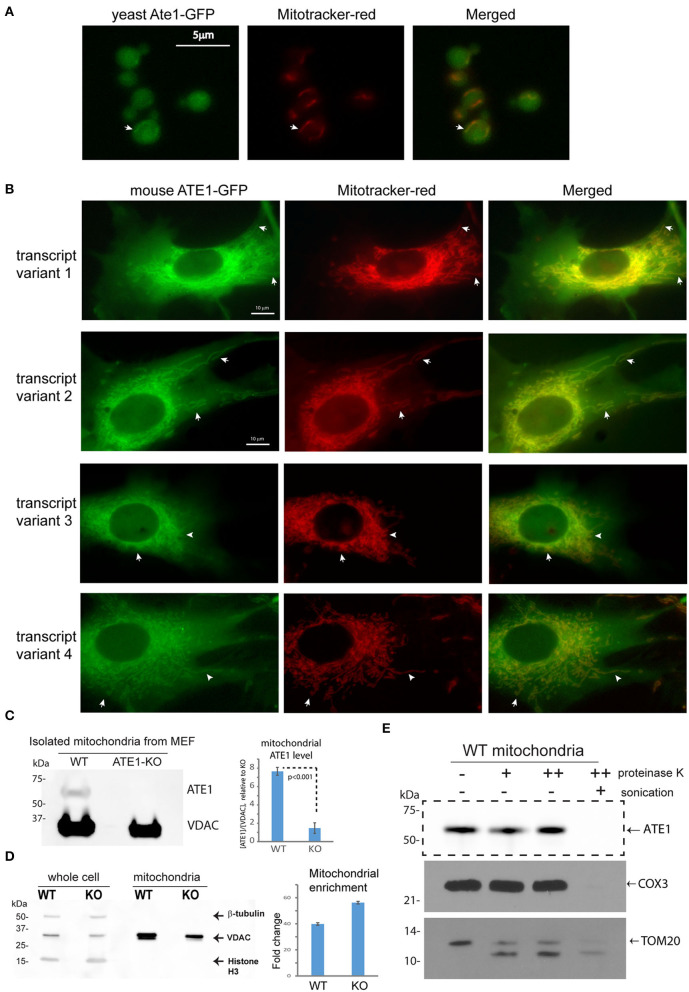
Figure 2.
ATE1 locates inside mitochondria. (A) The location of yeast Ate1 is traced by a GFP fused to the C-terminus of the endogenous Ate1 on the chromosome of S. cerevisiae. The location of Ate1 (shown in green) is then compared to the mitochondria-specific dye, Mitotracker-Red (shown in red). White arrows point to locations where colocalization of Ate1 and mitochondrial structure can be seen. Scale bar indicates 5 micrometers. (B) A recombinant mouse ATE1 is fused a C-terminal GFP and stably expressed in mouse embryonic fibroblasts (MEF) with ATE1-knockout (referred as “KO” in figure labeling hereon). All four known protein isoforms from splice variants (1, 2, 3, and 4) of the ATE1 gene were examined. The location of GFP-fused ATE1 (shown in green) is compared to mitochondria stained with Mitotracker-Red (shown in red). White arrows point to locations where discrete mitochondrial structures are seen. See also Supplementary Figure 1A for the expression levels of the different ATE1 isoforms. Scale bar indicates 10 micrometers. (C) Representative Western blot using a monoclonal antibody that recognizes all four ATE1 isoforms showing a detectable band of endogenous ATE1 in mitochondria from WT MEF, but not from ATE1-KO (KO) cells. Antibody for VDAC was used as a loading control on the same blot for mitochondria mass. The experiment was repeated 3 times (n = 3). On the right side is the quantification showing the specific signal of ATE1 associated with mitochondria in WT cells. The signal in ATE1-KO cells is used as background control for normalization. The error bar represents standard error of mean (SEM) and the statistical significance was calculated by the t-test. See also Supplementary Figure 1B for the estimate of the percentage of mitochondria-associated ATE1 in relation to the total cellular ATE1. (D) The purity of mitochondria isolated from WT and ATE1-KO cells were examined by Western bot with antibodies against beta-tubulin, VDAC, and histone 3, which are markers for cytosol, mitochondria), and nucleus, respectively. The whole cell lysate was used as control. On the right side shows the chart of quantification of mitochondrial enrichment, which was calculated from three independent repetitions (n = 3) by the ratio of VDAC over tubulin in the mitochondrial fraction vs. the whole lysate. The bar graph represents the mean ± SEM. (E) Representative Western blot showing the mitochondrial proteinase K protection assay. The signs of “–,” “+,” “++” for proteinase K indicate increasing concentrations (0, 0.32, or 0.64 μg/ml) of proteinase K. An arrow indicates the expected size of ATE1. On the lower side is the Western blot of the digestions of different mitochondria-associated proteins as controls for localizations. These include COX3, which is located inside the mitochondrial matrix, and TOM20, a transmembrane protein anchored on the outer membrane of mitochondria.

