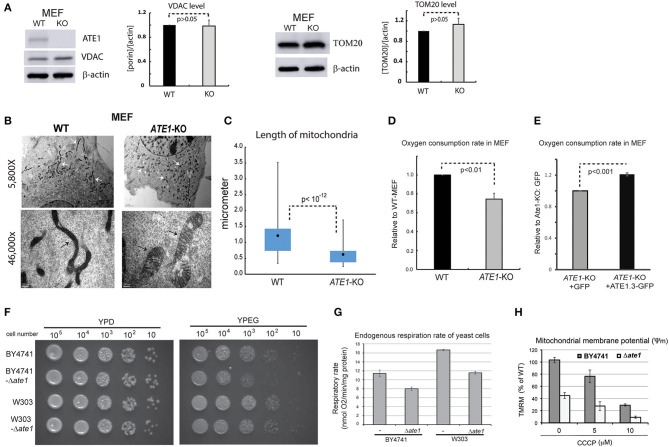
Figure 3.
ATE1 is essential for the morphology and function of mitochondria. (A) The steady state protein levels of mitochondrial mass markers, VDAC and TOM20, in WT and ATE1-KO MEF were examined by Western blot as shown by representative images (left panel) and quantification (right panel) (n = 4 for VDAC; n = 3 for TOM20). Beta-actin was used as a loading control. (B) Morphologies and sizes of mitochondria in WT and ATE1-KO MEF shown by negative staining at different magnifications under electron microscopy (5,800x in the upper row and 46,000x in the lower row, as labeled). The scale bars in upper row represent 2 micrometers, while the ones in lower row is 200 nanometers. The white arrows and black arrows indicate a few discrete mitochondria. (C) Graph showing box-whisker plots for the lengths of mitochondria in WT and ATE1-KO MEF. The quantification of WT cells were based on 115 discrete mitochondrial filaments (n = 115) in 6 electron-microscopy (EM) images containing 6 different cells, while for ATE1-KO was based on 122 discrete mitochondrial filaments in 4 EM images containing 4 different cells. (D) Oxygen consumption rates of the whole cell in WT and ATE1-KO MEF. The values in ATE1-KO cells were normalized to those in WT cells in each measurement. The bar graph represents the mean ± SEM of four independent measurements (n = 4). The p-value was calculated by t-test. See also Supplementary Figure 2 for representative images of the oxygen consumption curve. (E) Similar to (D), except that ATE1-KO MEF stably expressing GFP-fused recombinant ATE1, transcript variant 3 was measured. The expression of GFP alone was used as a control. The bar graph represents the mean ± SEM of four independent measurements (n = 4). The p-value was calculated by t-test. (F) The growth of yeast of BY4741 or W303 strain, with or without the deletion of the ATE1 gene, was examined by serial dilution on agar plates for either a fermenting condition with the glucose-containing rich media (YPD), or a respiring condition with the glycerol and ethanol-based media (YPEG). (G) The cellular oxygen consumption rates of yeast of BY4741 or W303 strain, with or without the deletion of the ATE1 gene. The bar graph represents the mean ± SEM of three independent measurements (n = 3). The p-value was calculated by t-test. (H) The level of membrane potential in BY4741 yeast, with or without the deletion of the ATE1 gene, in the increasing level of CCCP, quantified using TMRM staining and flow cytometry. The bar graph represents the mean ± SD of three independent measurements (n = 3). The p-value was calculated by t-test.

