Figure 4.
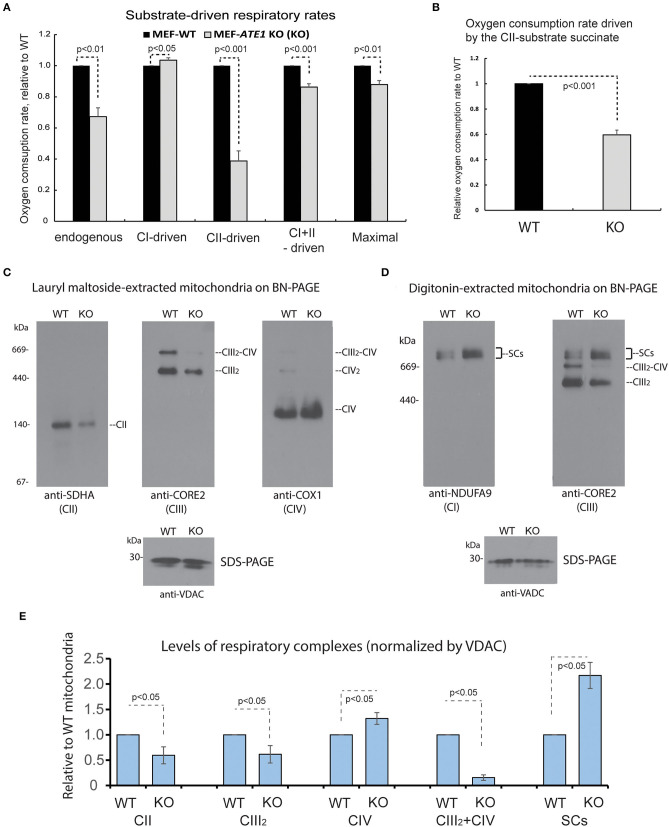
ATE1 differentially affects the composition and function of mitochondrial respiration complexes. (A) Oxygen consumption rates in intact whole cell (endogenous respiration) before permeabilization and CI and CII substrate-driven coupled respiration in digitonin-permeabilized WT and ATE1-KO (referred as KO) MEF. Glutamate plus malate were used as CI substrates, followed by succinate as a CII substrate. Maximal respiratory rates were measured upon addition of the uncoupler FCCP. The values in ATE1-KO cells were normalized to those in WT cells in each measurement. The bar graph represents the mean ± SEM of four independent measurements (n = 4). The p-value was calculated by t-test. See also Supplementary Figure 2 for representative images of the oxygen consumption curve. (B) Oxygen consumption rate in permeabilized cells in presence of only complex II substrate succinate in WT and ATE1-KO MEF. The bar graph represents the mean ± SD of four independent measurements (n = 4). The p-value was calculated by t-test. (C) Individual respiratory complexes of isolated and lauryl maltoside-extracted mitochondria were separated by blue-native polyacrylamide gel (BN-PAGE) and then examined in Western blot. SDHA, CORE2, and COX1 are established markers for complex II, III, and IV (referred as to CII, CIII, CIV in figure labeling), respectively. The CIII2-CIV supercomplex is also indicated. In the bottom panel, VDAC levels assessed by SDS-PAGE and immunoblotting are shown as loading control. (D) Similar to (A), except that digitonin was used to extract mitochondrial proteins to preserve supercomplex association. NDUFA9 and CORE2 are established markers for complex I and III (CI and CIII), respectively. SCs indicates CI-containing supercomplexes (CI+CIII2+CIVn). (E) Quantitative assessment of the assembly and organization of different respiratory complexes and CI-containing supercomplexes (SCs) in mitochondria from WT and ATE1-KO MEF, extracted with lauryl maltoside or digitonin and separated by BN-PAGE. The bar graph represents the mean ± SEM of three independent repetitions (n = 3). The p-value was calculated by t-test.

