Figure 5.
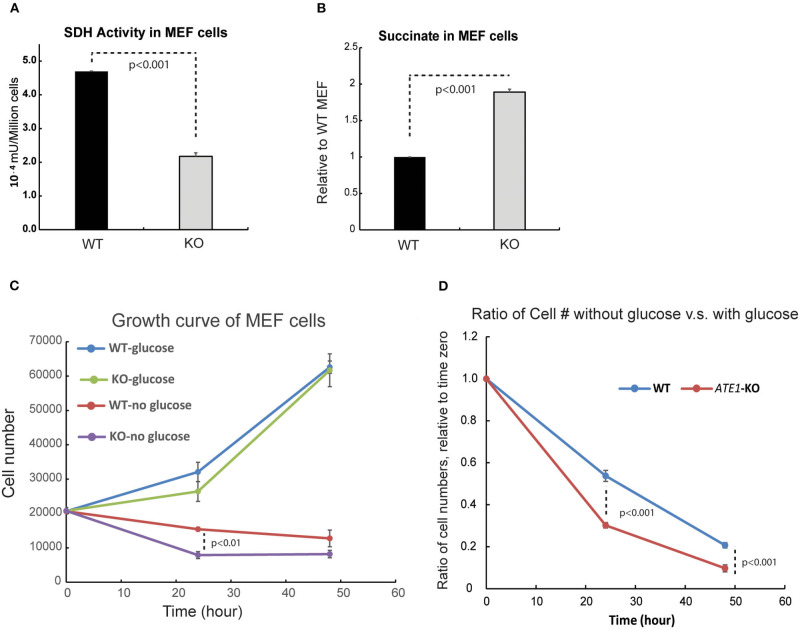
ATE1 affects the level of succinate and the cellular dependency of glucose. (A) The specific activity of succinate dehydrogenase (SDH) in WT and ATE1-KO MEF normalized by cell number. The bar graph represents the mean ± SEM of four independent measurements (n = 4). The p-value was calculated by t-test. (B) Comparison of the cellular concentrations of succinate in WT and ATE1-KO MEF (n = 3), normalized by the concentration in WT cells. The bar graph represents the mean ± SEM of three independent measurements (n = 3). The p-value was calculated by t-test. (C) The growth curves of WT and ATE1-KO MEF in the presence or absence of glucose. Each point represents the mean ± SEM of six independent measurements (n = 6). The p-value was calculated by t-test. (D) The sensitivities of WT and ATE1-KO MEF to glucose-starvation, represented by the ratio of cell number in glucose-free condition compared to that in high-glucose condition in the same time point as shown in (C). Each point represents the mean ± SEM of six independent measurements (n = 6). The p-value was calculated by t-test.

