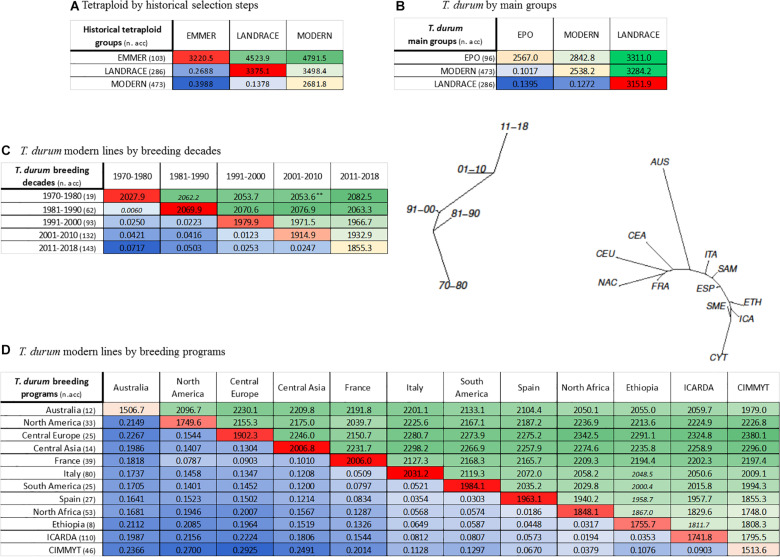
FIGURE 2.
Population differentiation calculated as pairwise Fst and average number of pairwise differences between groups/populations defined according to passport data for: (A) evolution from domesticated emmer, to landraces, to modern lines; (B) all T. durum groups of EPO, landraces, modern lines; (C) T. durum modern lines classified according to decade of release; (D) T. durum modern lines classified based on breeding program. In each matrix, above diagonal elements (shades of green) contain the average number of pairwise differences, while below diagonal elements (shades of blue) report pairwise Fst values. Diagonal elements (shades of red) contain gene diversity within groups calculated as mean number of pairwise differences. Significance was assessed upon 1000 permutations. All values are significant at p < 0.001, except values marked with ** which were significant at p < 0.01, or values in italics that were not significant. Relative Neighbor-Joining phylogenetic tree based on Nei’s distance are also reported for panels (C,D).

