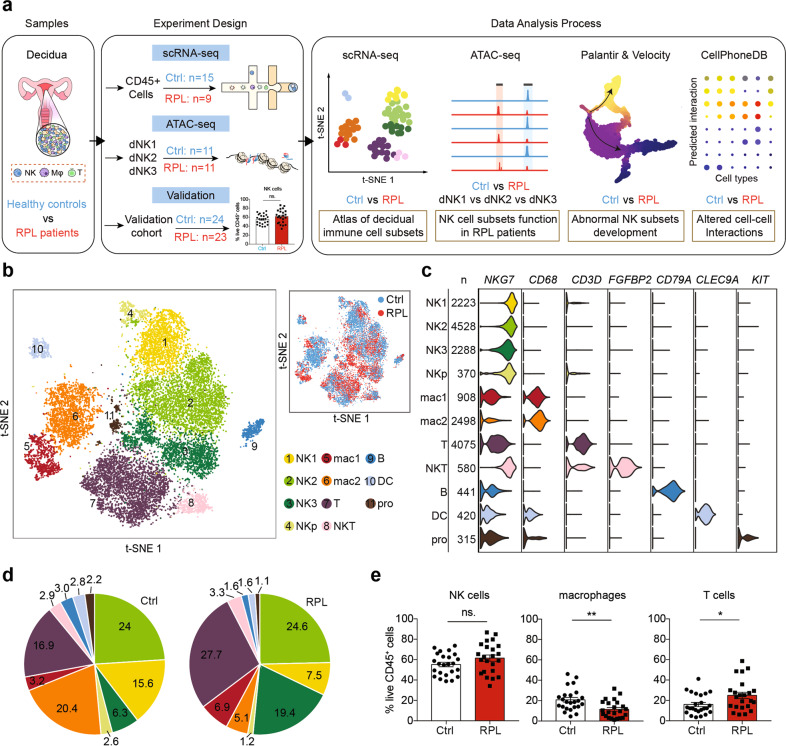
Fig. 1. An atlas of decidual immune cells in RPL patients.
a Flowchart depicting the overall design of the study. Numbers indicate the number of individuals analyzed. b A t-SNE projection of the 18,646 total CD45+ leukocytes from nine RPL patients and 15 healthy controls, indicating 11 main clusters. Different colors indicate cell clusters and disease status (see legend for key). NKp, proliferating natural killer cells; pro, progenitor cells. c Violin plots of selected marker genes (upper row) for multiple immune cell subsets. The first column shows the names of the decidual cell clusters, the second column represents the numbers of cells in each cluster. d Pie chart showing the proportion (i.e., % of total sequenced immune cell complement) for each of the 11 cell clusters in healthy controls and RPL patients. e Flow cytometry analysis of a larger cohort of healthy controls and RPL patients (including those sequenced in scRNA-seq), showing the proportions of the decidual NK cells, macrophages, and T cells among the gated CD45+ leukocytes. ns, P > 0.05; *P < 0.05; **P < 0.01; Student’s t-test. All points are shown and bars represent means with SEM (nc = 24, np = 23; np: number of RPL patients, nc: number of healthy controls).

