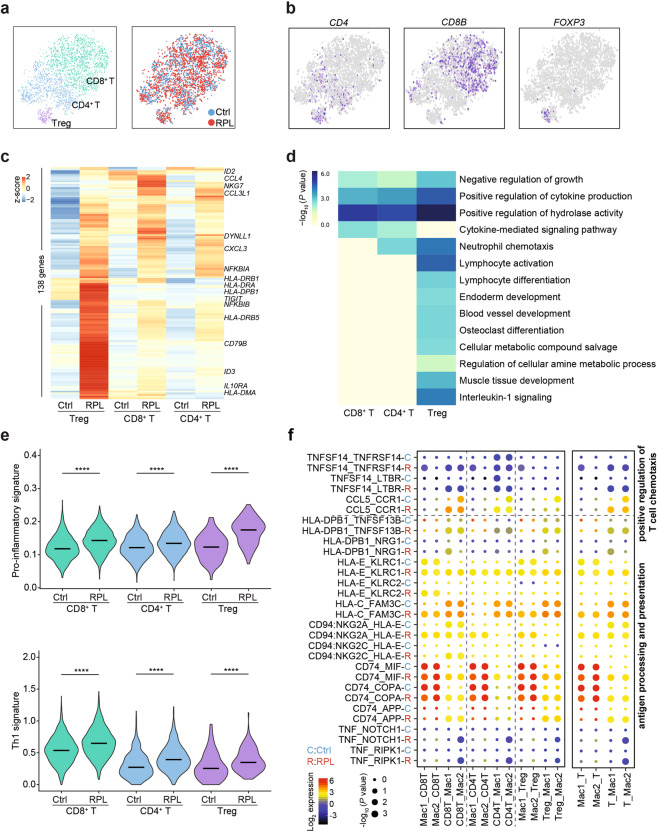
Fig. 5. T cell subsets and their interactions with macrophages.
a t-SNE plots of 4071T cells, indicating three main clusters (left) from RPL patients and healthy controls (right). Colors indicate cell clusters and disease status. b t-SNE plots showing the expression of marker genes in each T cell subset. c Heatmap for unsupervised clustering of the differentially expressed genes between healthy controls and RPL patients, assessed for each of the three T cell subsets. d Heatmap of the enriched genomic features of the differentially expressed genes between healthy controls and RPL patients. e Violin plots of the pro-inflammatory and Th1 signature genes’ expressions in T cell subsets from healthy controls and RPL patients. ****P < 0.0001. Significance was evaluated with Student’s t-test. f Dot plot of the predicted interactions of macrophages with T cells in the RPL patients and healthy controls. P values were indicated by circle size. The expression levels of all the interacted genes were indicated by colors, scales on the right.

