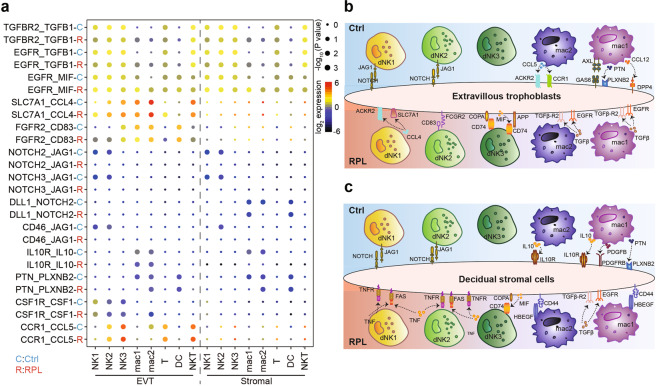
Fig. 6. Alteration of decidual immune responses in RPL patients.
a Dot plot of predicted interactions of immune cells with EVTs and with stromal cells in the RPL patients and healthy controls. P values were indicated by circle size. The expression levels of all the interacted genes were indicated by colors, scales on the right. b, c Summary illustrations depicting the altered interactions of decidual immune cells with EVTs (b) and stromal cells (c) in healthy controls (up) and RPL patients (down).

