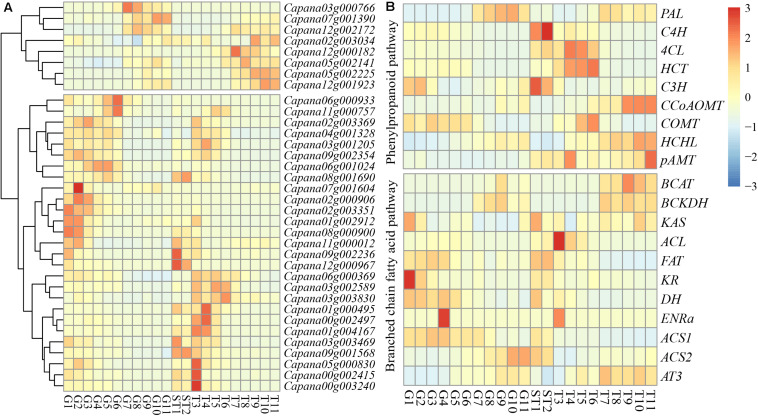
FIGURE 5.
Expression patterns of CaR2R3-MYB DEGs and CBGs. Expression profiles using RNA-seq Fragments Per Kilobase Million (FPKM) data in the pericarp between ten DAP and 60 DAP (G1-G11), placenta and seed between ten DAP and 15 DAP (ST1 and ST2), and the placenta between 20 DAP and 60 DAP (T3-T10). (A) CaR2R3-MYB DEGs expression level (B) CBGs. CBGs including PAL: phenylalanine ammonia lyase; C4H: cinnamate 4-hydroxylase; 4CL: 4-coumaroyl-CoA ligase; HCT: hydroxycinnamoyltransferase; C3H: coumaroylshikimate/quinate 3-hydroxylase; CCoAOMT: caffeoyl-CoA 3-O-methyltransferase; COMT: caffeic acid O-methyl transferase; HCHL: hydroxycinnamoyl-CoA hydratase/lyase; pAMT: putative aminotransferase; in phenylpropanoid pathway, and BCAT: branched-chain amino acid transferase; KAS: ketoacyl-ACP synthase; ACL: acyl carrier protein; FAT: acyl-ACP thioesterase; ENR, enoyl-ACP reductase; KR, ketoacyl-ACP reductase; DH, hydroxyacyl-ACP dehydratase; ACS: acyl-CoA synthetase; AT: acyltransferase; in branched chain fatty acid pathway. The color scale at the left of each dendrogram represents log2 expression values, with red indicating high levels and blue indicating low levels of transcript abundance.

