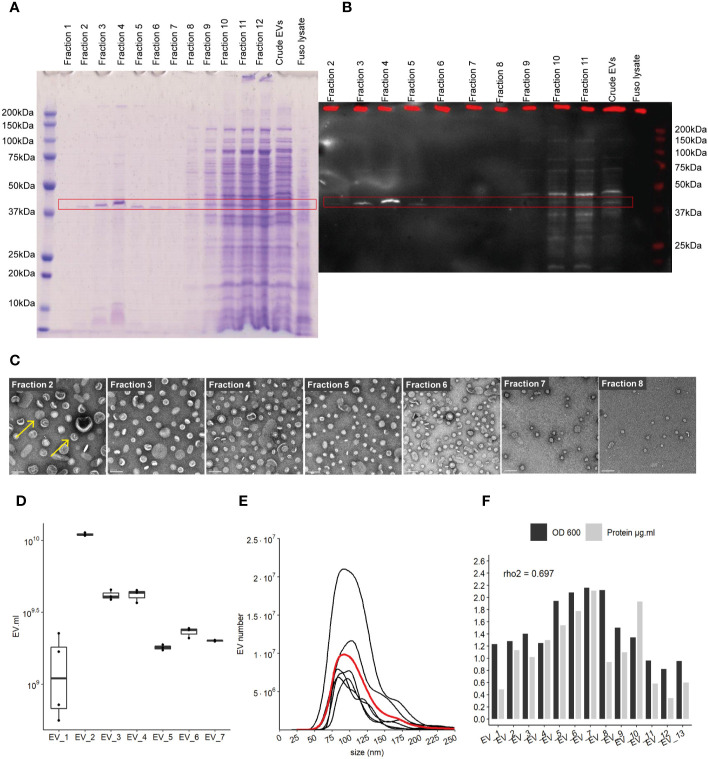
Figure 1.
Characterization of EVs derived from F. nucleatum. (A) density gradient fractions of total protein profile stained with Coomassie Blue. (B) EVs fractions identified by far-western blot using a FomA specific biotinylated peptide derived from statherin protein, highlighted by the red rectangle. (C) EVs fractions 2 to 8 imaged by TEM; scale bar, 100 nm. Yellow arrows give examples of EVs structures (D) EVs count using NTA methods in 7 extraction batches, normalized by the volume of culture. (E) Size (nm) distribution of EVs in 7 distinct cultures and extractions, black lines represent individual EVs extraction, red line shows the mean distribution of 6 different purifications. (F) Protein concentration in each purification as determined by the BCA method and normalized by the initial volume of culture, biomass measured by optical density (OD) at 600 nm.

