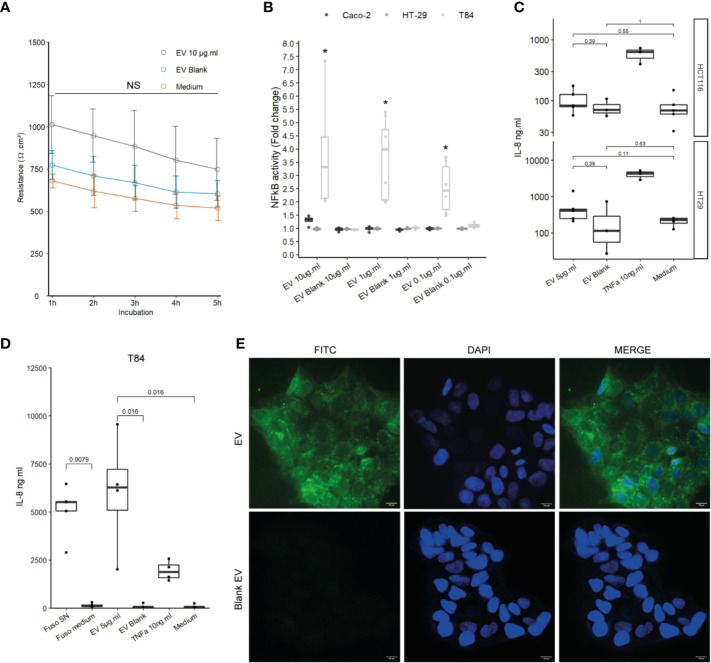
Figure 2.
Impact of EVs on intestinal epithelial cells and innate immunity. (A) Epithelial resistance monitored in Caco-2 differentiated cells exposed to 10 µg.ml−1 EV for 5 h or Blank EV (Ω.cm²). Data are represented as the average of three experiments ± SD. Exact p-value of EVs vs Blank EV were 1 h: 0.110; 2 h: 0.093; 3 h: 0.104; 4 h: 0.188; 5 h: 0.199 (T test). (B) NF-κB activation level in Caco-2, T84 and HT-29 NF-κB reporter cell lines after incubation of 24 h with different EVs concentrations. Caco-2 and HT-29 p-values were not significant. T84 p-value from left to right: 0.0357, 0.0090, and 0.0095. Data are expressed as median ± quartiles of fold change toward unstimulated cells. (C) Secreted IL-8 measured by ELISA in HCTT16, HT-29 stimulated with 5µg.ml−1 EVs, Blank EV or TNF-α 10ng.ml−1 for 24 h (N = 3). (D) Secreted IL-8 measured by ELISA in T84 cells stimulated with F. nucleatum supernatant, control medium, 5 µg.ml−1 EVs, Blank EV or TNF-α 10 ng.ml−1 for 24 h (N = 4). (E) (Upper left panel) 5 µg of FITC-labeled EVs or (Lower left panel) 5 µg of Blank EVs, were incubated on T84 cells for 3 h, 100X, FITC (Green), nucleus DAPI (Blue); scale bar, 10µm.

