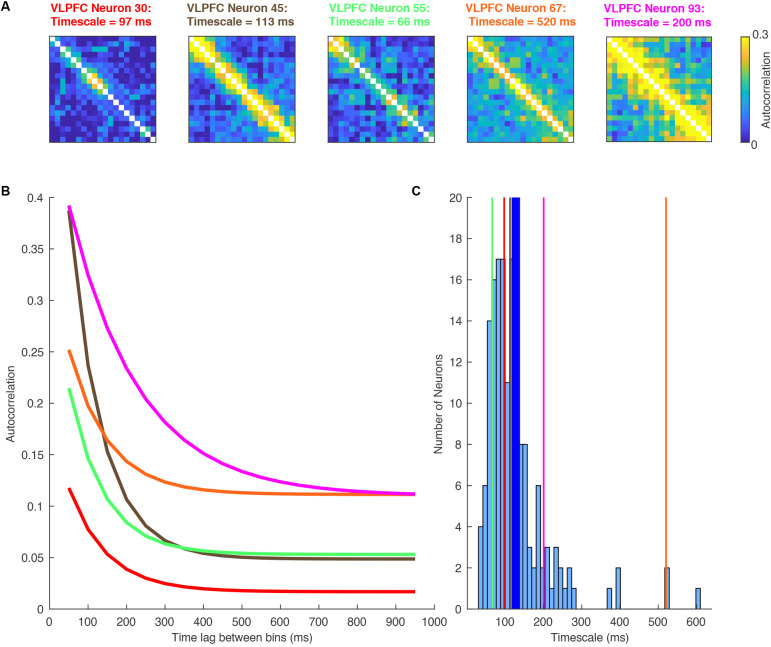
Figure 2.
A Heterogeneity of single-neuron timescales exist within a brain region. Data recorded from the ventrolateral prefrontal cortex (VLPFC) during a working memory task (Cavanagh et al., 2018). (A) Autocorrelation structure of five VLPFC neurons, plotted as a function of time within the pre-trial fixation period. As in Figure 1B, these are calculated by correlating the spike count autocorrelation across trials. Despite being recorded in the same brain region, there is a large degree of diversity. (B) Autocorrelation structure of VLPFC neurons, plotted as a function of the time lag between bins. As in Figure 1B, the data from above have been sorted by the time lag. Each of the lines corresponds to an exponential fit of the decaying autocorrelation of one of the neurons’ heatmaps above (corresponding color). There is substantial heterogeneity in the individual neurons making up the whole region average. Each neuron has an exponential decay reasonably distinct from the population average. (C) Histogram showing the single neuron exponential decay time constant assigned to all neurons within VLPFC. The vertical lines mark the example neurons shown in this figure. The thicker blue line marks the population mean.

