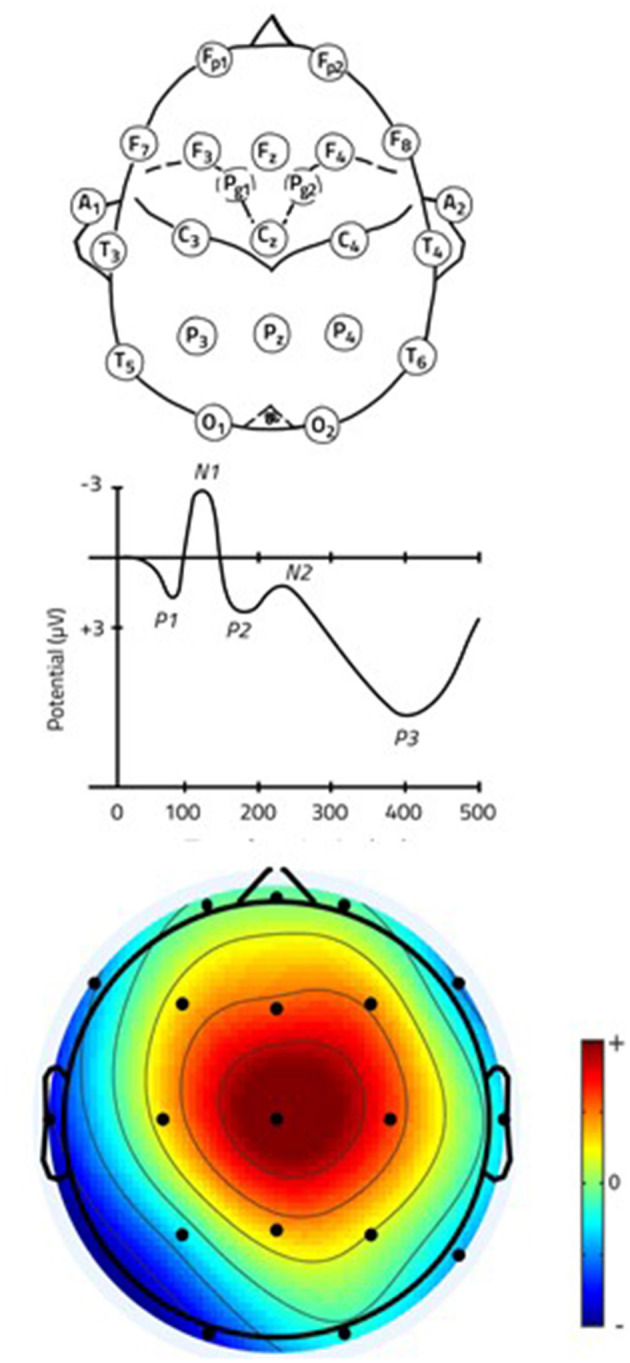
Figure 2.

EEG set-up, ERPs and spectral map. Top: Position of 24 electrodes according to the International 10–20 system. Front to back: Fronto-polar, Frontal, Pharyngeal, Auricular, Central, Temporal, Parietal, Occipital (Sazgar and Young, 2019); Center: Event-Related Potentials (ERPs) classified based on latency with respect to the stimulus; Bottom: Spectral map showing EEG activation at P200 latency (the color code represents the topographic distribution of the voltage values).
