Figure 1.

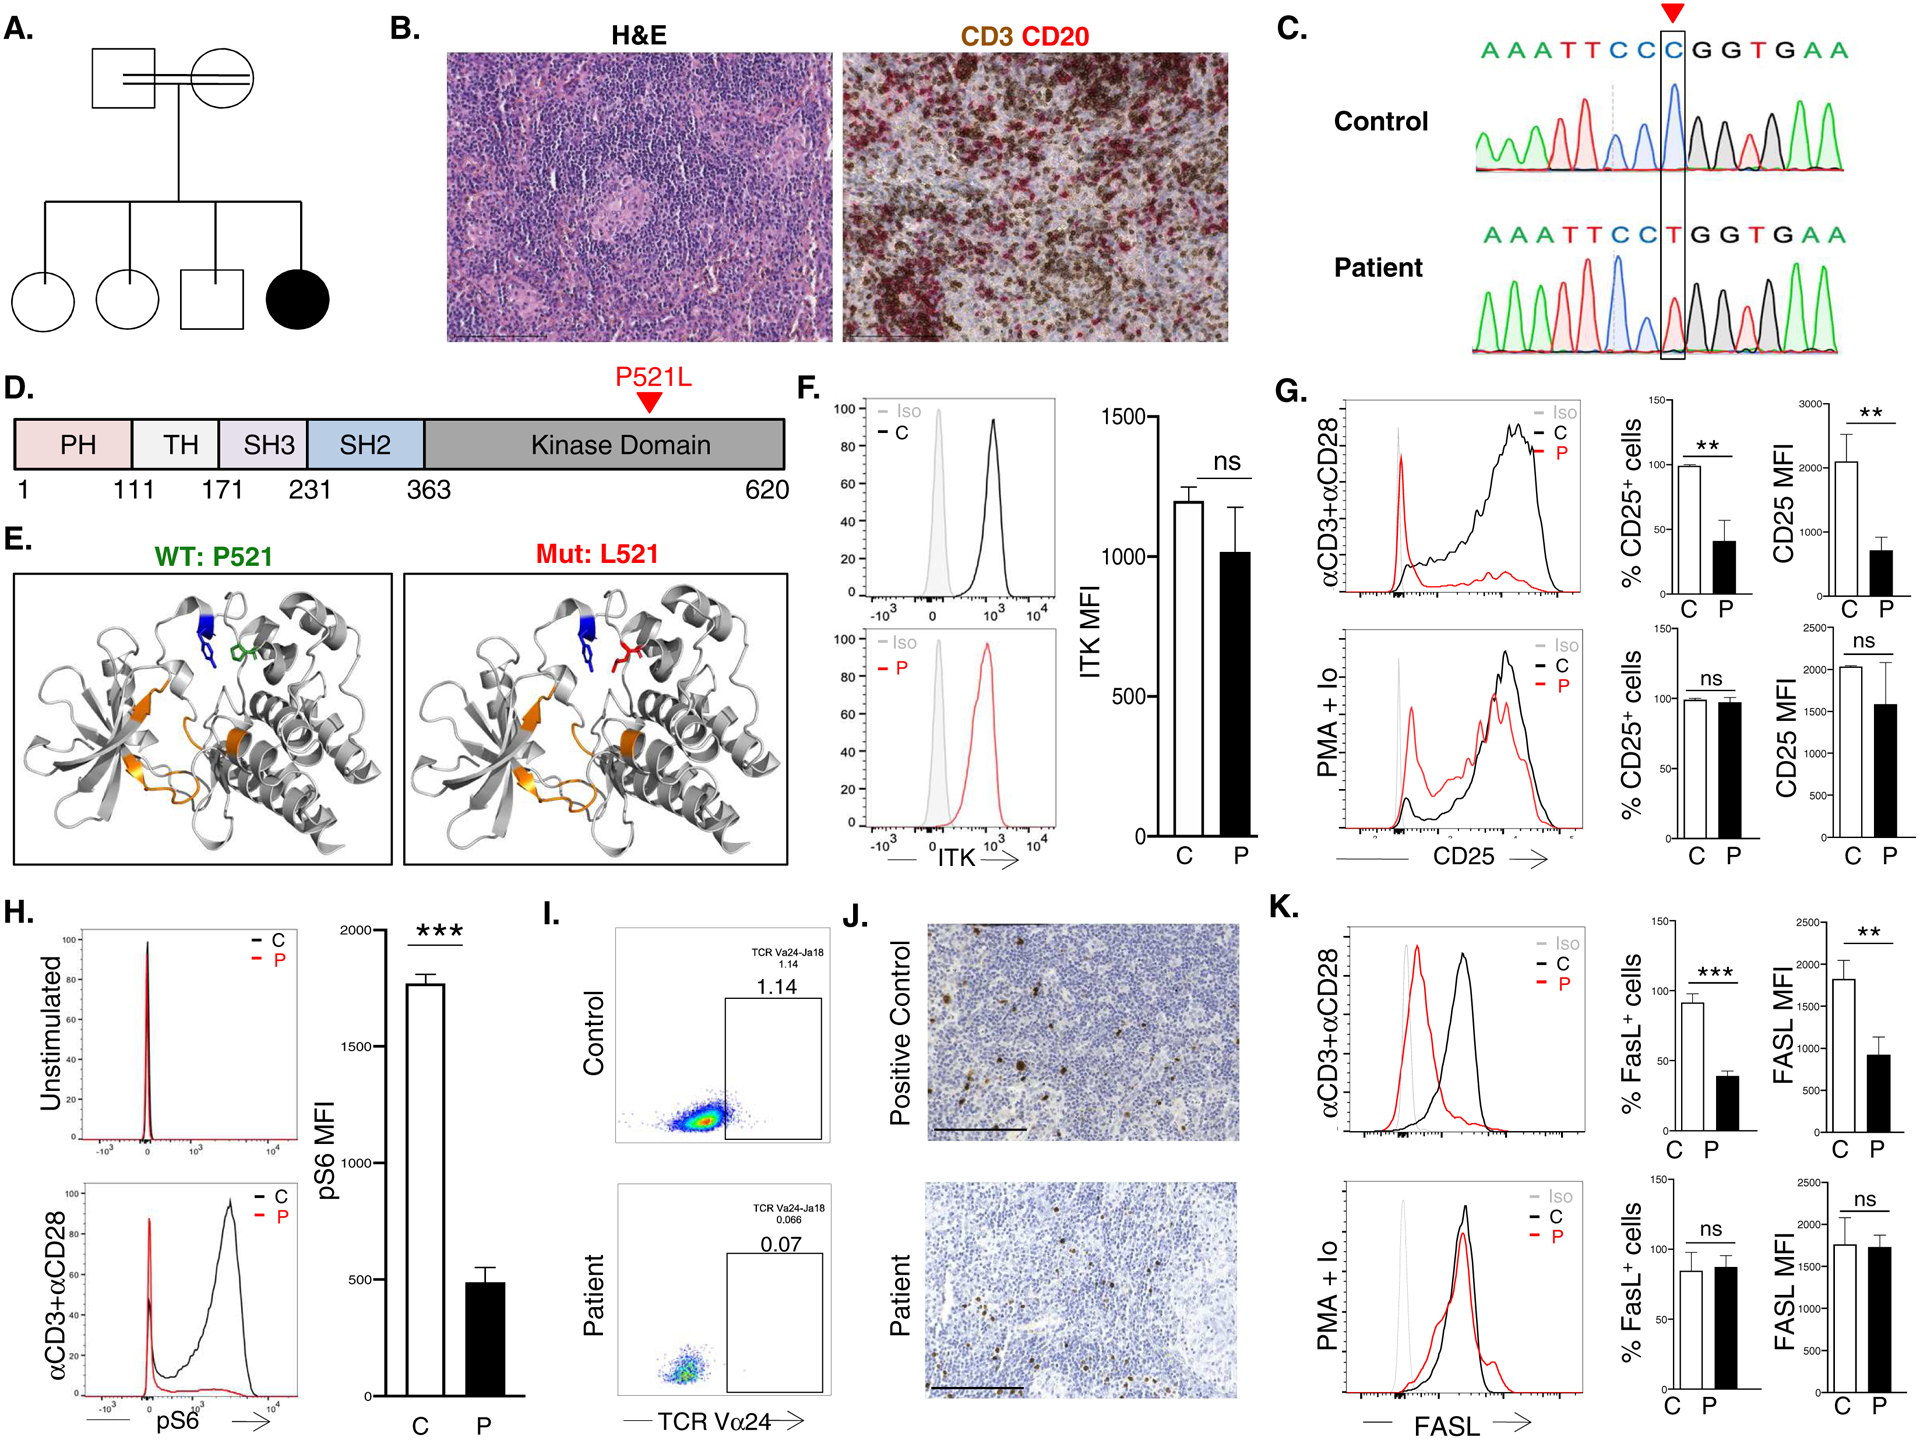
A. Pedigree. B. H&E (left) and IHC (right) of abdominal LN. Scale bar 150μm. C. Sanger sequencing of the ITK c.1562C->T mutation. D. Linear map of ITK with domains shown in different colors.. E. Ribbon diagram of the ITK kinase domain (gray): Y512 (blue), ATP binding domain (orange), P521 on the left (green) and mutant L521 (red) ion the right. F. Representative FACS (left) and quantitative analysis of mean fluorecence intensity (MFI) (right) of ITK in T cells G. Representative (left), and quantitative analysis of the percent CD25+ cells (middle) and CD25 MFI (right) in T cells stimulated with αCD3+αCD28 or PMA+Ionomycin. H. Representative (left) and quantitative analysis (right) of S6 phosphorylation in αCD3+αCD28 simulated T cells. I. FACS analysis of blood TCR Vα24+ iNKT cells among CD4+ cells. J. EBV-encoded RNA in situ hybridization in LN from positive control and patient. Scale bar 150μm. K. Representative FACS (left) and quantitative analysis of the percent FASL+ cells (middle) and FasL MFI (right) in T cells stimulated with αCD3+αCD28 or PMA + Ionomycin. Columns and bars are mean±SD of 3 independent determinations in the patient and 3 controls. ns, not significant; *p<0.05; **p<0.01, ***p<0.001; using one-way ANOVA for multiple comparisons or Student’s t test for two groups.
