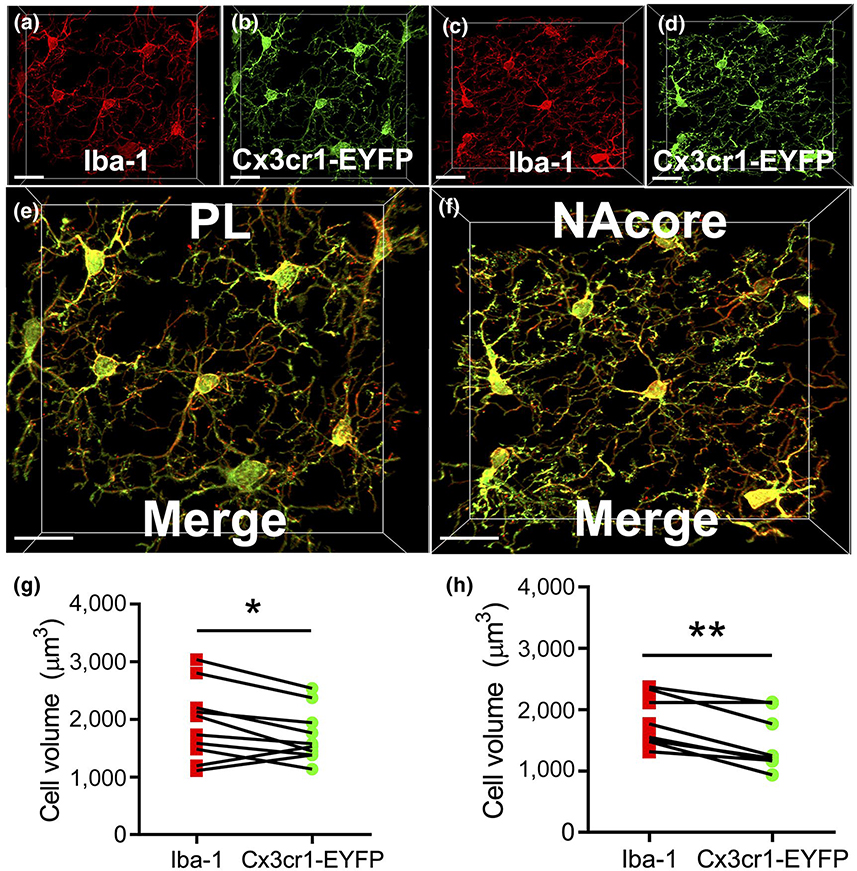
FIGURE 2.
Cellular reconstructions of microglia from genetic and immunofluorescent labeling techniques produce similar results. (a,b) Labeling produced by Iba1 IHC (Red) and Cx3cr1-EYFP fluorescence (Green) in the prelimbic (PL) portion of the PFC in Cx3cr1-EYFP mice (n = 3). Isolation of microglia for cell volume analyses were done as described within the materials and methods section. (c,d) Labeling produced by Iba1 IHC and Cx3cr1-EYFP fluorescence in the NAcore in Cx3cr1-EYFP mice. (e,f) High magnification merged image of data shown in (a-d). (g,h) Quantification of isolated cell volume using either Iba1 or Cx3cr1-EYFP signal as the source channel in PL cortex (g) and NAcore (h). Scale bars = 20 μm

