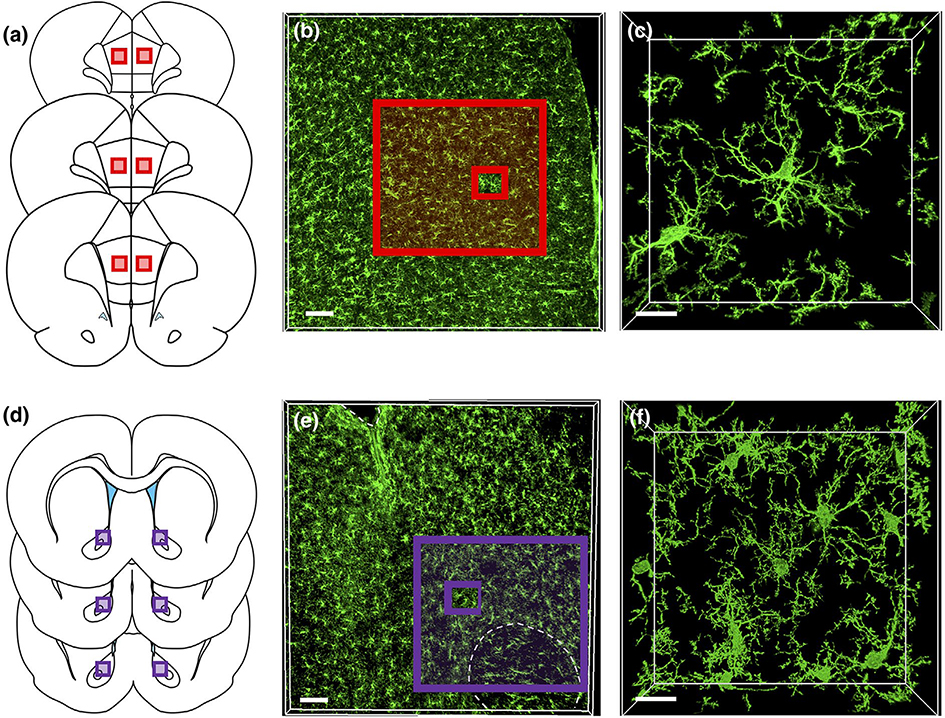
FIGURE 3.
Representative microglia syncytia in the prelimbic (PL) cortex and NAcore (a) The PL subdivision of the medial prefrontal cortex was sampled along the anterior-posterior axis. (b) Low-magnification image of Iba1 immunoreactivity in the PL cortex. (c) High-magnification image of Iba1 immunoreactive microglia in the PL cortex. The outer red-boxed region in (b) represents the area that corresponds to the box region shown in (a), while the smaller inset red box represents the image area shown in (c). (d) The NAcore subdivision of the nucleus accumbens was also sampled from sections across the anterior-posterior axis as described above. (b) Low-magnification images of Iba1 immunoreactivity in the NAcore. (c) Higher magnification image of Iba1 immunoreactive microglia in the NAcore. As above, the outer purple-boxed region in (e) represents the area that corresponds to the box region shown in (d) while the smaller inset purple box represents the image area shown in (f). Scale bars = 100 μm (b,e) and 15 μm (c,f)

