

Abstract
Neurofibromatosis type 1 (NF1) is a heritable cancer predisposition syndrome resulting from mutations in the NF1 tumor suppressor gene. Genotype-phenotype correlations for NF1 are rare due to the large number of NF1 mutations and role of modifier genes in manifestations of NF1; however, emerging reports suggest that persons with NF1 display a distinct anthropometric and metabolic phenotype featuring short stature, low body mass index (BMI), increased insulin sensitivity, and protection from diabetes. Nf1 heterozygous (Nf1+/−) mice accurately reflect the dominant inheritance of NF1 and are regularly employed as a model of NF1. Here, we sought to identify whether Nf1+/− mice recapitulate the anthropometric and metabolic features identified in persons with NF1. Littermate 16–20 week-old male wildtype (WT) and Nf1+/− C57B/6J mice underwent nuclear magnetic resonance (NMR), indirect calorimetry, and glucose/insulin/pyruvate tolerance testing. In some experiments, tissues were harvested for NMR and histologic characterization. Nf1+/− mice are leaner with significantly reduced visceral and subcutaneous fat mass, which corresponds with an increased density of small adipocytes and reduced leptin levels. Additionally, Nf1+/− mice are highly reliant on carbohydrates as an energy substrate and display increased glucose clearance and insulin sensitivity, but normal response to pyruvate suggesting enhanced glucose utilization and preserved gluconeogenesis. Finally, WT and Nf1+/− mice subjected to high glucose diet were protected from diet-induced obesity and hyperglycemia. Our data suggest that Nf1+/− mice closely recapitulate the anthropometric and metabolic phenotype identified in persons with NF1, which will impact the interpretation of previous and future translational studies of NF1.
Keywords: Neurofibromatosis, insulin, adipocyte, metabolism, glucose, lipids, Cancer
Introduction
Neurofibromatosis type 1 (NF1) is the most common dominantly inherited cancer predisposition syndrome affecting 1 in 3,000 persons worldwide. Persons with NF1 develop characteristic neurofibromas, a benign nerve sheath tumor, gliomas, and myeloid leukemias as well as non-cancerous manifestations including cognitive delay, musculoskeletal abnormalities, and debilitating cardiovascular diseases. The high disease burden in multiple organ systems contributes to a much higher mortality rate in persons with NF1, particularly in those under age 40 years(1).
Germline mutations in a single NF1 tumor suppressor gene cause NF1. The timing of disease presentation and variable penetrance of any single manifestation within families affected by the same NF1 mutation undermines genotype-phenotype correlations for NF1 and suggests that somatic NF1 mutations resulting in tissue-specific loss of heterozygosity contribute to disease presentation and severity(2). However, recent cohort studies suggest that persons with NF1 share common features including short stature, sarcopenia, and lower body mass index (BMI), which is independent of the type and location of the NF1 mutation(3). An emerging body of evidence suggests that this unique body composition is accompanied by an altered metabolic phenotype. Persons with NF1 are much less likely to develop insulin resistance or die from diabetes-related complications(4, 5). In support of these epidemiologic observations, persons with NF1 exhibit lower fasting blood glucose and enhanced glucose clearance after administration of a glucose load when compared with age-, sex-, and BMI-matched controls(6, 7). Similarly, cytokines that are regulated by adipocytes, so-called adipokines such as leptin and adiponectin, display altered and advantageous metabolic patterns in persons with NF1 when compared with matched controls(7). These metabolic features may underscore why persons with NF1 appear to be protected from insulin resistance and type II diabetes(8). More importantly for persons with NF1, enhanced metabolism of glucose and other energy substrates may participate in tumor growth and transformation, immune responses, drug metabolism, and response to therapeutic interventions.
Animal models harboring germline and lineage-restricted Nf1 mutations have yielded valuable insight into the pathogenesis of multiple NF1 manifestations and provided a platform for identifying novel drug targets and efficacy studies of newly developed drugs. In particular, Nf1 heterozygous (Nf1+/−) mice recapitulate several NF1 manifestations including leukemias, pheochromocytomas, learning deficits, and arteriopathies(9–13). Further, cells isolated from Nf1+/− mice have a proliferative advantage over wildtype (WT) cells and are often used for mechanistic and high-throughput therapeutic testing(14–16). Based on the foundational use of Nf1+/− mice and murine-derived cells to the advancement of NF1 biology and drug discovery and the lack of previous metabolic and anthropometric comparative studies between humans with NF1 and Nf1+/− mice, we sought to identify whether Nf1+/− mice mimic the metabolic features common to persons with NF1. These studies have critical implications for the interpretation of previous and future studies using Nf1-mutant mice and will inform new mechanistic pathways for understanding NF1-related pathologies.
Materials and Methods
Animals
Experimental protocols were approved by the Institutional Animal Care and Use Committee at Augusta University (Augusta, Ga). Nf1+/− mice were obtained from Tyler Jacks, Ph.D., (Massachusetts Institute of Technology, Cambridge, MA) and backcrossed 13 generations into the C57BL/6J strain(9). Mice were genotyped by PCR as described(17). WT and Nf1+/− mice (C57BL/6J) were crossed to generate experimental progeny. Littermate male mice, between 16 and 20 weeks of age, were used for experiments. In some experiments, Nf1+/− and WT mice (8 week old) were provided a 30% glucose solution in water and standard chow feed diet for 16 weeks. During the high-glucose diet, body weight, non-fasting blood glucose, and food/water intake were measured each week. At the time of sacrifice, animals were anesthetized with an admixture of 2% isoflurane and 98% oxygen, weighed, and tissue harvested for further analysis.
Nuclear Magnetic Resonance
Littermate WT and Nf1+/− male mice were anesthetized using an admixture of 2% isoflurane and 98% oxygen. Total body fat and lean tissue were assessed using a Bruker minispec LF90 TD‐NMR analyzer, which was calibrated prior to each use(18). Following total body composition, mice were sacrificed and whole liver and the left gastrocnemius were harvested. To determine percent fat and lean mass in liver and skeletal muscle, a weighed portion of the right lobe of the liver and intact gastrocnemius were assessed by NMR.
Indirect Calorimetry
Indirect calorimetry was assessed using the Comprehensive Lab Animal Monitoring System (CLAMS). Littermate male WT and Nf1+/− mice (16 – 20 weeks old) were housed individually in oxymax cages (Columbus Instruments, Columbus OH) at 27°C for 5 days with a 12 hour light and 12 hour dark cycle(19). Mice were allowed to acclimate to the cages for two days prior to data collection. Food and water intake were measured each day and locomotor activity was measured for 24 hours using triple axis detection, beams set up in the x, y and z-axis as described(19). X and Y breaks are considered locomotor and Z-axis breaks indicate raising up on hind legs. Oxygen consumption (VO2; ml/kg × h) and carbon dioxide production (VCO2; ml/kg × h) were measured each 24 hours. The respiratory exchange ratio (RER) was calculated by volume of CO2 produced by the volume of O2 consumed as described(20).
Glucose, Insulin and Pyruvate Tolerance
For glucose tolerance testing (GTT), WT and Nf1+/− mice were fasted for 24 hours in a quiet room with free access to water. Prior to blood sampling, tails were cleaned and provided topical lidocaine (1%). Fasting blood glucose concentrations were measured prior to providing animals with a single intraperitoneal (IP) injection of dextrose (2gm/kg body weight, Sigma Aldrich, St. Louis, MO). Serial blood glucose measurements were made every 10 minutes for 120 minutes using a glucometer (AlphaTrak 2, Zoetis, Parsippany, NJ). For insulin tolerance testing (ITT), WT and Nf1+/− were fasted for 5 hours in a quiet room with free access to water and tails were prepped in a similar fashion to GTT. Animals received insulin (0.4U or 0.6U/kg, Novo Nordisk Bagsværd, Denmark) via IP injection and serial blood glucose measurements were performed at 10-minute intervals for 90 minutes. A pyruvate tolerance test (PTT) was performed after overnight fast. Animals were provided an IP injection of pyruvate (2gm/kg body weight, Sigma Aldrich, St Louis, MO) and serial blood glucose measurements were performed at 10-minute intervals for 90 minutes.
Lipoprotein, Cholesterol, and Hormone Analysis
Blood was collected from each animal at the time of tissue harvest. For Hemoglobin A1c measurements, blood samples were immediately measured using the A1C Now Diabetes Management HbA1C test kit (PTS Diagnostic, Indianapolis, IN). For lipoprotein, triglyceride, and cholesterol measurements, fresh serum was assayed using LDX Cholestech cartridges (Abbott, Chicago, IL) according to the manufacturer’s instructions. For hormone measurements, samples were allowed to sit at room temperature for 30 minutes, centrifuged at 2500 RPM for 10 minutes, and stored at −80°C until analysis using a Pro-diabetes multiplex assay from Bio-Rad (Bio-Rad, Hercules, CA).
Tissue Histology/ Analysis
At sacrifice, gastrocnemius, liver, interscapular fat, inguinal fat, and epidydimal fat pads were drop fixed in 4% paraformaldehyde for 24hrs and then dehydrated in 70% ethanol. Tissues were paraffin embedded, sectioned, and stained with hematoxylin and eosin. Separately, samples of liver and gastrocnemius were drop fixed in 4% paraformaldehyde and then incubated in 30% sucrose and stained for Oil Red-O. Image Pro Plus was used to quantify the area of lipid accumulation (Oil Red-O stained) in each section from the liver and skeletal muscle.
Statistical Analysis
Indirect calorimetry and Oil Red-O area analysis were assessed using 1-way ANOVA with Tukey’s post-hoc test for multiple comparisons. GTT, ITT, blood measurements and body composition were analyzed using Student’s t-test. An F-test was performed to identify sample variation and Welch’s test was performed for unequal variance or sample number. Analysis was performed using GraphPad Prism version 6.0h (La Jolla, CA, USA). p-value < 0.05 was considered significant. Indirect calorimetry, GTT, ITT, blood measurements, and body composition data are presented as mean ± standard deviation (SD). Oil Red-O quantification is presented as mean ± standard error of mean (SEM).
Results
Nf1 heterozygous mice are metabolically similar to persons with NF1
Persons with NF1 display a distinct metabolic phenotype with reduced muscle mass, decreased fat mass, and low BMI despite being short in stature. Such a phenotype may explain the difficulty in translating discoveries and drug targets from mice to humans with NF1. At the backbone of translational studies related to NF1, Nf1+/− mice represent a similar genetic background to persons with NF1 with only a single mutated Nf1 gene copy. Therefore, we subjected littermate WT and Nf1+/− mice to nuclear magnetic resonance (NMR) and placed them in a Comprehensive Lab Animal Monitoring System (CLAMS) for 5 days to identify key metabolic features of Nf1+/− mice. Although WT and Nf1+/− mice have similar body weight, Nf1+/− mice display an altered body composition as determined by NMR. The percent fat mass is significantly reduced and lean mass is modestly increased in Nf1+/− mice when compared with littermate WT mice (Figure 1A–C). The CLAMS unit represents a sealed environment wherein mouse activity and nutrient intake are closely monitored and direct measurements of oxygen, carbon dioxide (CO2), and heat are performed. Interestingly, Nf1+/− mice were less active than WT mice despite consuming similar quantities of food and water (Figure 1D and E). Further, heat production, a metabolic side product, was lower in Nf1+/− mice when compared with WT mice and may reflect the lower activity level (Figure 1F). Nf1+/− mice consumed significantly less oxygen than WT mice while CO2 production was similar between genotypes reflecting a reduction in mitochondria-driven energy production (Figure 1G and H). The respiratory exchange ratio (RER) represents the relationship between CO2 production relative to oxygen consumption and indicates whether carbohydrates or fatty acids are the predominant fuel source for energy supply. The RER for Nf1+/− mice is significantly higher than WT mice and suggests that Nf1+/− mice are more dependent on carbohydrates rather than fatty acids as a fuel source for energy (Figure 1I). Taken together, these data suggest that Nf1+/− mice have reduced fat mass, increased lean mass, and are more reliant on carbohydrates to meet their energy needs, which mirrors findings from clinical studies of persons with NF1(21, 22).
Figure 1: Nf1+/− mice have reduced fat mass, increased lean mass, and are more reliant on carbohydrates for energy.
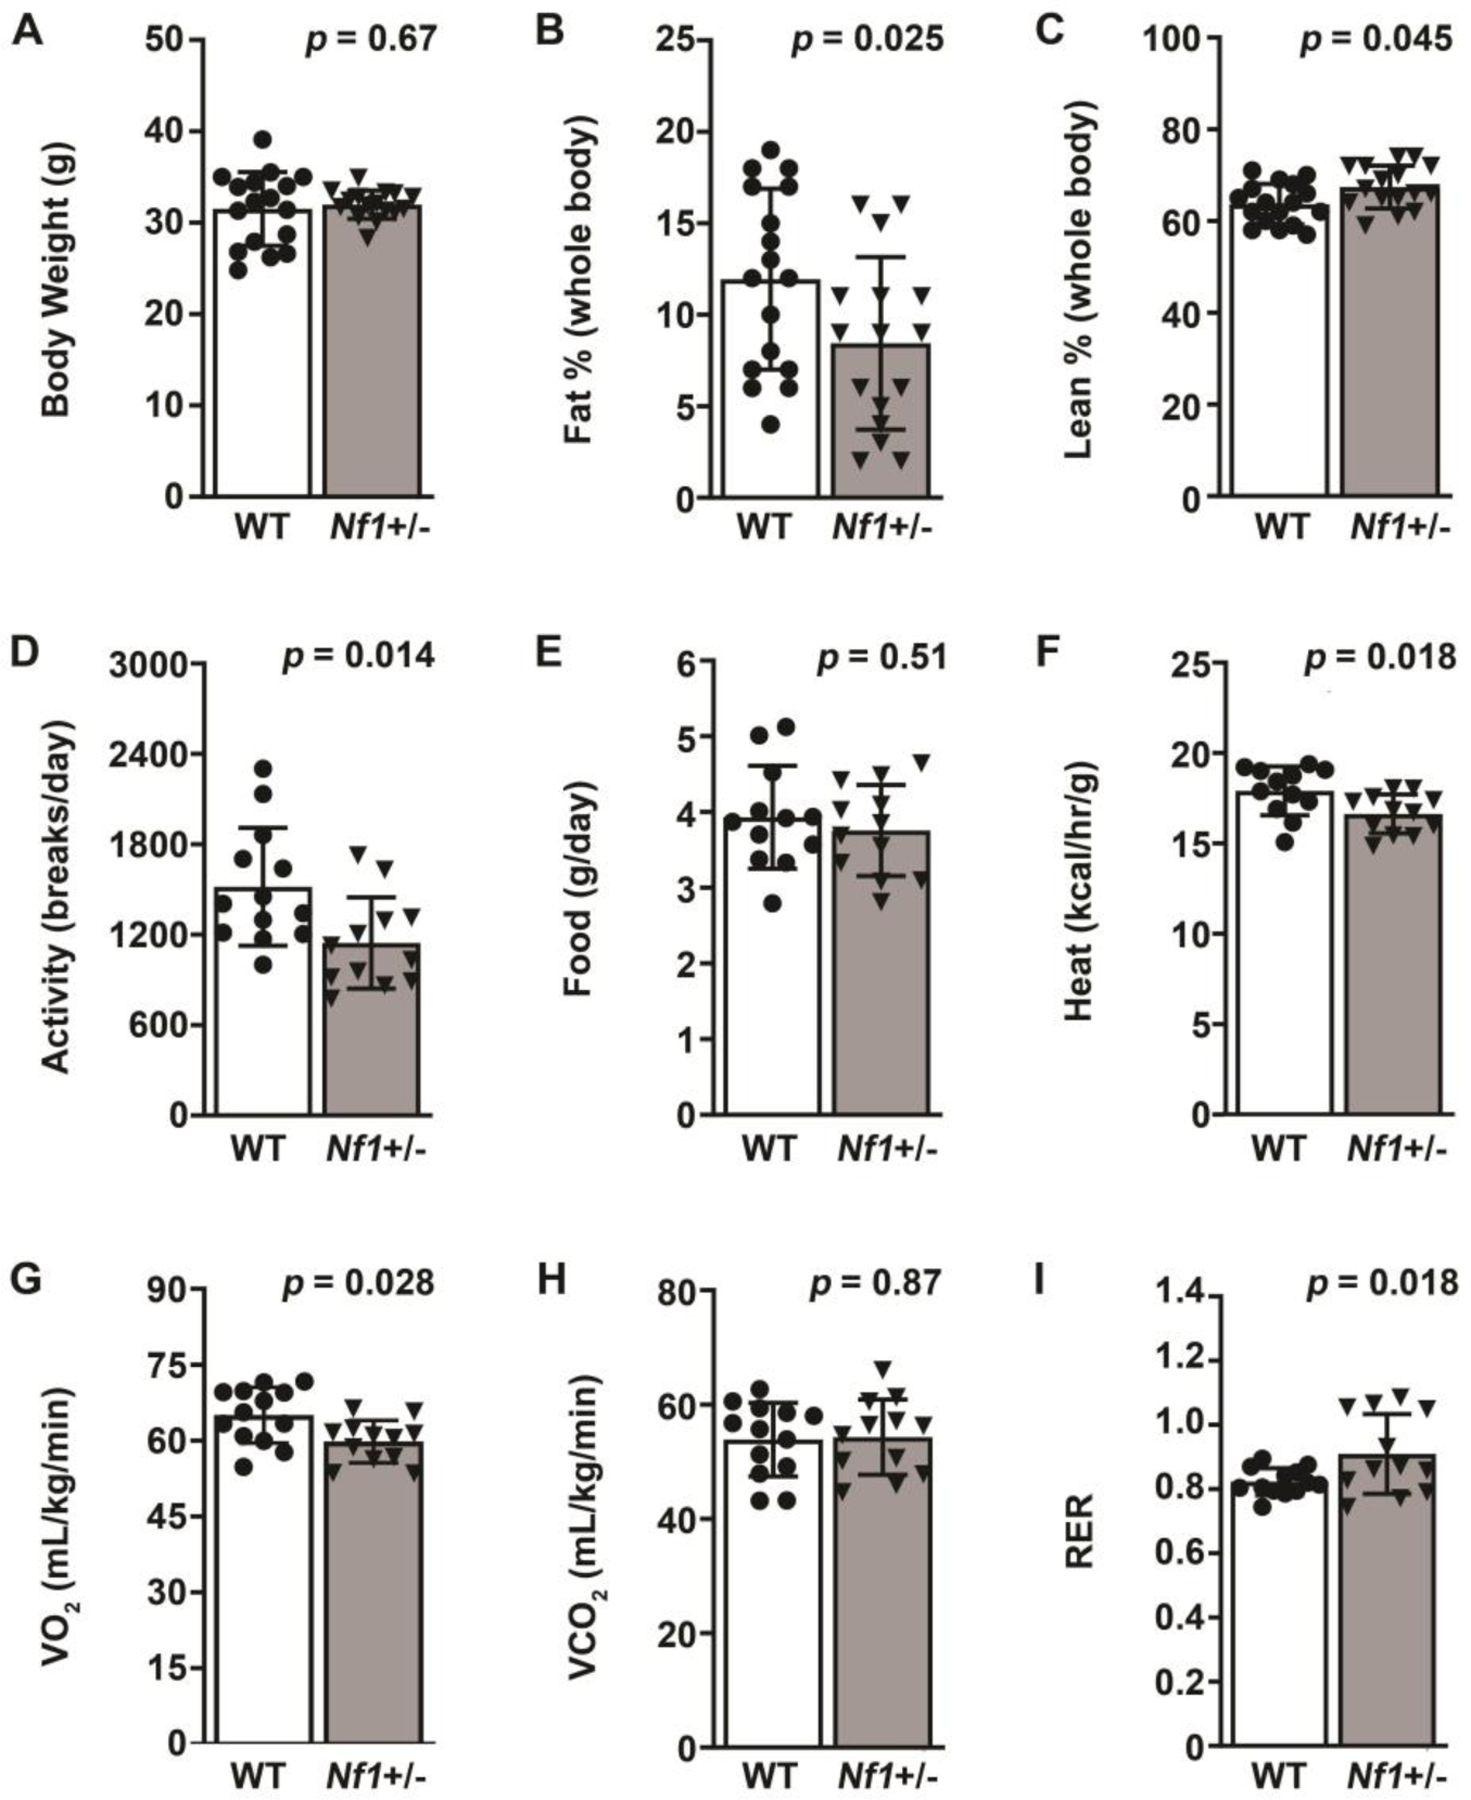
A-C. Body weight (A), percent fat mass (B), and percent lean mass (C) in WT (white bars) and Nf1+/− (black bars) mice measured by NMR. D-I. Activity measured in beam breaks on a triple axis (D), daily food intake in grams per day (E), energy expenditure in Calories per hour per gram body weight (F), volume of oxygen (VO2) consumed in milliliters per kilogram per minute (G), volume of carbon dioxide (VCO2) consumed in milliliters per kilogram per minute (H), and Respiratory Exchange Ratio (I) for WT (white bars) and Nf1+/− (black bars) mice as determined by Comprehensive Lab Animal Monitoring System (CLAMS). Data represent mean ± SD, n = 10 per group. Analysis by Welch’s test.
Nf1+/− mice have reduced fat mass, improved lipoprotein profile, and lower leptin levels
Based on the NMR data demonstrating reduced fat mass in Nf1+/− mice, we isolated visceral (epididymal fat), subcutaneous (inguinal fat), and brown (interscapular fat) adipose depots for further analysis. In comparison to WT mice, visceral fat mass was reduced nearly 3-fold in littermate Nf1+/− mice (Figure 2A and B). Quantification of hematoxylin and eosin-stained visceral fat depots identified increased density, but reduced cross-sectional area for adipocytes isolated from Nf1+/− mice when compared with WT mice (Figure 2C and D). A similar, but less dramatic reduction in subcutaneous fat mass observed in Nf1+/− mice (Figure 2E and F). Impressively, the cell density in subcutaneous fat depots from Nf1+/− mice was increased over two-fold while cross-sectional area was reduced two-fold when compared with WT mice (Figure 2G and H). Brown adipose mass was also reduced in Nf1+/− mice when compared with WT mice (4.1 ± 1.6 mg/g vs. 7.1 ± 1.7 mg/g, p = 0.006). Tibia and nose-to-tail length were similar between Nf1+/− and WT mice, and visceral organ (e.g. liver and kidney), and gastrocnemius weight corrected to total body weight did not differ between genotypes (data not shown). Previous reports have suggested that lipid deposition in non-adipose tissues may be altered in Nf1-mutant mice. Lipid deposition was significantly reduced in livers isolated from Nf1+/− mice (Figure 3A and B) but lipid content was nearly 3-fold higher in skeletal muscle from Nf1+/− mice (Figure 3C and D), which confirms a previous report showing increased lipid deposition in skeletal muscle from an NF1 patient and Nf1-mutant mice(23).
Figure 2: Nf1+/− mice have reduced fat mass.

A-H. Representative photomicrographs of hematoxylin and eosin stained sections and quantification of visceral (A-D) and subcutaneous (E-H) adipose tissue from WT (white bars) and Nf1+/− (black bars) mice. For quantification, bilateral fat pad mass is corrected to total body weight (B and F) and expressed as grams per gram. C-D and G-H. Quantification of adipocyte number per mm2 (C and G) and cross-sectional area (D and H) for visceral (C and D) and subcutaneous (G and H) from WT (white bars) and Nf1+/− (black bars) mice. Data represent mean ± SD, n = 10 per group. Analysis by Welch’s test.
Figure 3: Nf1+/− mice have altered lipid deposition in liver and skeletal muscle.

A-D. Representative photomicrographs of Oil Red-O stained sections (A and C) and quantification of percent lipid area for liver (B) and gastrocnemius (D) from WT (white bars) and Nf1+/− (black bars) mice. Data represent mean ± SD, n = 10 per group. Analysis by Welch’s test.
Based on the clear differences in the fat depots, we assayed peripheral blood for lipoprotein concentrations and total cholesterol as well as several adipose-related hormones. High-density lipoprotein (HDL) concentration was significantly increased as was triglyceride levels, while low-density lipoprotein (LDL) was reduced nearly 2-fold in Nf1+/− mice when compared with littermate WT mice (Figure 4A). The total cholesterol-to-HDL ratio was also reduced in Nf1+/− mice when compared with WT mice (Figure 4B). The lower TC/HDL ratio reflects a higher concentration of cholesterol contained within HDL particles in Nf1+/− mice when compared with WT mice. Finally, we assayed the peripheral blood of WT and Nf1+/− mice for adipokines, so-called cytokines secreted by adipocytes, and other hormones that reflect and control energy production. Similar to persons with NF1, Nf1+/− mice have significantly lower circulating leptin levels when compared with littermate WT mice (Figure 4C). Resistin, an adipokine with controversial roles in adipocyte-immune cell communication, did not differ between genotypes, while ghrelin, a hormone that promotes growth hormone release, was modestly elevated in Nf1+/− mice (Figure 4C).
Figure 4: Nf1+/− mice have improved lipoprotein profile and lower leptin levels.

A and B. Quantification of serum lipoprotein and triglyceride concentration in milligrams per deciliter (A), total cholesterol-to-HDL ratio (B) in WT (white bars) and Nf1+/− (black bars) mice. Data represent mean ± SD, n = 10 per group. C. Serum leptin, resistin, and ghrelin concentration in picograms per milliliter in WT (open circles) and Nf1+/− (closed boxes) mice. Individual data points shown and bar reflects mean value. Analysis by Welch’s test.
Nf1 heterozygosity increases glucose utilization and insulin sensitivity
Recent reports suggest that persons with NF1 rarely develop fasting hyperglycemia and are more sensitive to insulin(6, 7). The relationship between improved glucose clearance and NF1 was particularly evident in persons with NF1 classified as overweight or obese, a strong risk factor for insulin resistance and glucose intolerance(6). Based on these clinical observations, we fasted littermate WT and Nf1+/− mice for 24 hours and provided them with a glucose load and measured blood glucose concentrations every 10 minutes for 2 hours. Initial blood glucose values after the 24 hour fast did not differ between groups, but HgbA1c was modestly lower in Nf1+/− mice (4.62% ± 0.13% vs. 4.45% ± 0.15%; p-value = 0.02). In response to a glucose load, Nf1+/− mice had lower peak blood glucose values and recovered more quickly when compared with WT mice (Figure 5A). After a 1-week recovery period, we challenged the same mice with insulin and measured blood glucose concentrations over time. Interestingly, after a brief fast of 5 hours, Nf1+/− mice had dramatically lower starting blood glucose concentrations when compared to WT mice (Figure 5B). In response to insulin, WT and Nf1+/− mice had similar rates of blood glucose decline over the first 30–45 minutes; however, Nf1+/− mice exhibited a much slower recovery period from 45–90 minutes. To examine whether the differences in genotypes is due to alterations in glucose utilization (i.e. glycolysis) or gluconeogenesis, we subjected WT and Nf1+/− mice to a pyruvate tolerance test. No difference in blood glucose values between genotypes were identified suggesting that gluconeogenesis is preserved in Nf1+/− mice (Figure 5C). Based on the finding that Nf1+/− mice have increased utilization of glucose and sensitivity to insulin, which is similar to persons with NF1, we assayed the peripheral blood of WT and Nf1+/− mice for glucose-regulating hormones. Insulin concentrations (Figure 5D) did not differ between genotype, which is consistent with studies of humans with NF1(7). Somewhat surprisingly, the mean glucagon concentration was statistically higher in the Nf1+/− cohort, but concentrations of other glucose regulating hormones including gastric inhibitory peptide and glucagon-like peptide-1 did not differ between genotypes (Figure 5D).
Figure 5: Nf1+/− mice exhibit increased glucose clearance and insulin sensitivity.

A-C. Quantification of blood glucose concentration in milligrams per deciliter over time and area under the curve (AUC) in response to glucose (A), insulin (B), and pyruvate (C) for WT (open circles, white bars) and Nf1+/− (closed boxes, black bars) mice. Data represent mean ± SD, n = 6–8 per group. Analysis by Student’s t-test. **p < 0.01. D. Serum insulin, glucagon, gastric inhibitory peptide, and glucagon-like peptide 1 concentrations in picograms per milliliter in WT (open circles) and Nf1+/− (closed boxes) mice. Individual data points shown and bar reflects mean value. Analysis by Welch’s test.
Nf1 heterozygous mice are protected from diet-induced obesity and hyperglycemia
Based on the increased lean mass, reduced fat mass, and evidence of increased glucose utilization observed in Nf1+/− mice, we subjected WT and Nf1+/− mice to a diet containing 30% glucose in their drinking water and a standard chow feed for 16 weeks. At the conclusion of the study diet, WT mice had gained an average of 50% increase in body weight as compared to an average of 30% increase in body weight for the Nf1+/− cohort (Figure 6A). As expected, WT mice developed significant hyperglycemia with a mean increase of 200% over their initial blood glucose prior to commencing the diet. Strikingly, Nf1+/− mice did not develop hyperglycemia after 16 weeks of a 30% glucose drinking water solution and had nearly identical blood glucose values at the beginning and end of the study (Figure 6B). Differences in fat and lean mass between genotypes observed prior to the diet were noticeably absent after the 16-week diet (Figure 6C and D). Serum levels of hormones regulating glucose handling and adipocyte function were similar between genotypes after 16 weeks of a 30% glucose in water diet (Figure 6E).
Figure 6: Nf1+/− mice are protected from diet-induced obesity and hyperglycemia.

A and B. Quantification of percent body weight (A) and percent blood glucose (B) change in WT (white bars) and Nf1+/− (black bars) mice after 16 weeks of a 30% glucose drinking water solution. Data represent mean ± SD, n = 5–7 per group. Analysis by Student’s t-test. C and D. Quantification of percent body fat (C) and lean (D) mass in WT (white bars) and Nf1+/− (black bars) mice after 16 weeks of a 30% glucose drinking water solution. Data represent mean ± SD, n = 5–7 per group. Analysis by Student’s t-test. E. Serum insulin, leptin, and resistin concentrations in picograms per milliliter in WT (white bars) and Nf1+/− (black bars) mice after 16 weeks of a 30% glucose drinking water solution. Data represent mean ± SD, n = 5–7 per group. Analysis by Welch’s test.
Discussion
NF1 is a heritable multi-system disease resulting from mutations in the NF1 tumor suppressor gene. The NF1 gene is large containing 60 exons with a high mutation rate (1 in 10,000) and more than 2,800 mutations identified to date(2). Neurofibromin, the gene product of NF1, is a large multi-functional protein, but is predominantly recognized as a GTPase-activating protein (GAP) for p21Ras (Ras). Inactivating mutations in NF1 impair the binding affinity and activity of neurofibromin’s GAP-domain to suppress Ras signaling leading to enhanced phosphorylation of downstream kinases including Erk 1/2 and Akt. Although neurofibromin’s GAP domain for Ras (exons 20–27a) is the most well-studied of its attributes, most NF1 mutations occur outside the GAP domain. The dispersion and variety of mutations across the NF1 gene along with the well-recognized participation of modifier genes to NF1-related pathologies supports the clinical observations that genotype-phenotype correlations for NF1 are largely absent(24).
Apart from the common manifestations of NF1 that often present in childhood or early adulthood, a characteristic morphological phenotype including macrocephaly, short stature, and lower BMI than matched comparison groups has been described. Short stature coupled with lower BMI in persons with NF1 is particularly intriguing since short stature is strongly associated with obesity, diabetes, and other cardiometabolic diseases(25, 26). Conversely, lower BMI is identified more often with taller stature. This unusual association would suggest that energy uptake, storage, or utilization is altered in persons with NF1 when compared with the general population. In support of this hypothesis, a recent registry study of nearly 2,500 persons with NF1 demonstrated that persons with NF1 have statistically lower odds of hospitalization for endocrine-related diseases, including diabetes and obesity, when compared with the general population(27). In fact, endocrine-related hospitalization was the only category of 12 studied to produce a negative association with NF1 and suggests that persons with NF1 might exhibit some protection against endocrine-related diseases.
Additional insight from human NF1 cohorts and matched controls suggests that a metabolic phenotype may be common among persons with NF1. A comprehensive study of body composition using dual energy X-ray absorptiometry (DXA) in 26 persons with NF1 and age-, sex, and BMI-matched controls identified a modest, but not significant reduction in fat and lean mass in persons with NF1 when compared with controls(22). An important consideration in the design and interpretation of this study is the choice to match participants for BMI. By matching for BMI, the study design introduces a potential confounding phenomenon where the correction variable (i.e. BMI) is causally associated with the outcome of interest, which in this case is body composition. This may lead to a “reversal paradox” and undermine the results by creating false or inverse relationships(28). Further, correction for BMI between cohorts that have statistically significant differences in height forces the cohorts to conform to weight differences as well. When expressing lean and fat mass as a percent of total body weight, the median value for percent lean mass is higher while the percent of fat mass is slightly reduced in the NF1 cohort when compared with the control cohort, which matches our own findings in Nf1+/− mice. The modalities used to assess body composition in persons with NF1 and Nf1+/− mice should not impact the characterization since NMR is shown to provide more consistent and accurate results than DXA in rodents(29), but DXA closely approximates MRI in quantifying fat mass in human studies.
We also demonstrate that fat depot mass indexed to body weight is significantly reduced in Nf1+/− mice, which may be due to the formation of smaller, but great numbers of adipocytes in Nf1+/− mice when compared with WT mice. In humans, visceral adipose tissue content correlates directly with risk for insulin resistance, dyslipidemia, and cardiometabolic disease while subcutaneous adipose content may play a protective role against metabolic disease. However, some have speculated that abnormal deposition of subcutaneous fat in the abdomen supports an unfavorable metabolic profile(30). These roles are more controversial in rodents where subcutaneous adipose tissue may play a larger role. Removal of either visceral or subcutaneous fat depots in rodents has beneficial effects in glucose metabolism, insulin signaling, and reduces tumorigenesis(31); however, removal of subcutaneous, but not visceral adipose tissue increases serum triglyceride measurements in mice suggesting that this depot serves as a “sink” to regulate the influx of daily nutrients into long-term energy stores(32). The reduction in adipose tissue mass likely explains the higher triglyceride and HDL, but lower LDL concentrations observed in the blood of Nf1+/− mice when compared with WT mice. A single descriptive report of 60 persons with NF1 suggested that mean HDL and LDL concentrations fall within expected norms(33, 34). Given the homogeneity of littermate mice and the multi-faceted genetic, environmental, and dietary contributions to human lipoprotein concentrations and adiposity, the observed differences in mice likely reflects the isolated genetic contribution of Nf1 mutations to lipoprotein levels and fat mass. Finally, we identify that leptin levels are uniformly lower in Nf1+/− mice when compared with WT mice, which reflects a similar trend observed in humans with NF1(7). This is an important correlate between rodents and humans since leptin is a major hormone regulating hunger cues and energy distribution and storage.
Human cohort studies also suggest that glucose utilization is enhanced in persons with NF1. In a cohort of 57 persons with NF1 matched 3:1 for age, sex, and BMI, the NF1 cohort had a lower median fasting blood glucose concentration and reduced numbers of persons with a fasting blood glucose greater than 100mg/dL. More interesting, only 3 of 25 persons with NF1 classified as overweight (BMI>25) had a fasting blood glucose level greater than 100mg/dL compared to 71% of overweight controls(6). This is a striking difference since obesity and visceral adiposity are the greatest drivers of insulin resistance and hyperglycemia. In a follow up study of 40 persons with NF1 and matched controls, leptin concentration was reduced two-fold while adiponectin levels were increased 50% in the NF1 cohort when compared with the control cohort. While no differences in blood glucose or incidence of hyperglycemia following a bolus of dextrose were identified between the cohorts, the median HOMA-AD, a sensitive marker of insulin resistance, was nearly two-fold lower in the NF1 cohort when compared with the control cohort(7). Taken together, these studies point to greater glucose utilization or impaired glucose generation in persons with NF1. Our findings in Nf1+/− mice support and extend these observations. Similar to the human cohorts, Nf1+/− mice are much more efficient utilizers of glucose in the absence and presence of exogenous insulin. Importantly, insulin levels did not differ between groups. Somewhat surprisingly, we did identify a statistically significant increase in glucagon levels in Nf1+/− mice, which strongly points to an inherent need to increase glucose production in response to increased glucose uptake and/or increased glycolysis by metabolically active tissues in Nf1+/− mice. Further, we show that pyruvate administration does not affect blood glucose values in Nf1+/− mice suggesting that the lower blood glucose levels are most likely the result of glucose metabolism rather than a defect in gluconeogenesis.
In order to adequately test our hypothesis that Nf1+/− mice are more efficient glucose utilizers than WT mice, we provided littermate WT and Nf1+/− mice with a 30% glucose solution for drinking water along with a standard chow diet for 16 weeks. Importantly, this diet is commonly used to induce obesity, insulin-resistance, and hyperglycemia in C57BL/6J mice(35). After 16 weeks of a high-glucose diet, Nf1+/− mice demonstrated less weight gain when compared with WT mice and were strongly protected against hyperglycemia. These findings are even more striking when you consider that fat mass doubled in Nf1+/− mice in comparison to the more modest 50% increase in fat mass observed in WT mice. As a reflection of the high glucose load, insulin levels in both genotypes increased over 10-fold while the relationship between leptin within each genotype was preserved. The dramatic increase in serum insulin levels in both genotypes and lack of hyperglycemia observed in Nf1+/− mice in response to a high-glucose diet strongly suggests that Nf1+/− mice maintain insulin sensitivity and are protected from insulin resistance even in the face of an abundance of dietary glucose. These findings are supported by recent work by Martins and colleagues demonstrating enhanced insulin sensitivity and the lack of reports of insulin resistance and/or diabetes identified in persons with NF1(7).
Our work is the first to characterize the metabolic features of Nf1+/− mice, the genetic variant that most closely mirrors the NF1 population. We identify discrete, highly conserved phenotypes between Nf1+/− mice and humans with NF1 including enhanced insulin signaling and glucose utilization and a striking reduction in fat depot mass. Each of these findings has significant implications for mechanistic studies and drug discovery related to NF1. First, tumor formation in general is highly-related to glucose and fatty acid metabolism since tumors are well-recognized as metabolically active tissues. The Warburg effect summarizes the predisposition for tumor cells to use glycolysis for the rapid generation of energy substrates rather than the slow, but efficient oxidative phosphorylation pathway. Interestingly, hyperglycemia supports tumor growth in humans and rodents while lower glucose levels slow tumor growth and improve outcomes. It remains to be demonstrated whether the high availability of extracellular glucose for metabolically active tumor cells or the movement of glucose into the cell to meet intracellular energy needs is the major driver for the relationship between hyperglycemia and tumor progression. In the setting of NF1, it is reasonable to conclude that the efficient uptake and/or utilization of available glucose participates in tumor development, growth, and transformation. If this is true, drugs targeting glucose uptake or catabolism may play a vital role in the treatment of NF1-related disease.
Second, the reduction in fat mass and increased density of small adipocytes within the visceral and subcutaneous fat depots in Nf1+/− mice suggests that adipocyte maturation is altered by mutations in Nf1. Adipocytes are ubiquitous and embedded in a loose extracellular matrix that provide structure and biochemical signals to surrounding cells to regulate cell proliferation, migration, and differentiation. More importantly, fat depots serve as energy sinks to regulate fatty acid and glucose stores for juxtaposed and remote tissues, and the maintenance of adipocyte function is tightly regulated by the surrounding microenvironment(36). Adipocytes are also identified in NF1-related tumors including neurofibromas and adipocyte density appears to be an important driver of neurofibroma growth(37).
In cell-of-origin studies, loss of heterozygosity in a single cell line is insufficient to generate most manifestations of NF1, including neurofibromas; however, Nf1 homozygosity coupled with an Nf1 heterozygous microenvironment is sufficient to produce neurofibromas along with other manifestations of NF1 that are absent in Nf1+/− or lineage-restricted Nf1 null murine lines(38). Given the influence of adjacent adipocytes in all tissues relevant to NF1 and remote effects of fat depots, it is reasonable to suspect that the changes in adipocyte biology resulting from germline Nf1 heterozygosity may influence the timing and progression of NF1-related diseases. Importantly, we identified that leptin levels are greatly reduced in Nf1+/− mice, which mimics findings in persons with NF1. Interestingly, leptin is densely expressed in a subtype of neurofibroma, termed lipomatous neurofibroma, and leptin signaling is closely linked to several NF1-relevant tumors including breast cancer and glioma(37, 39). It remains to be determined how inherently low circulating leptin levels in Nf1+/− mice and humans with NF1 affect the genetic predisposition for certain manifestations of NF1 linked to leptin signaling.
Finally, perturbations in Ras signaling caused by inactivation of neurofibromin are closely linked to insulin signaling and glucose metabolism. The downstream phosphorylation of Erk 1/2 and Akt are negatively regulated by neurofibromin’s action on Ras. Conversely, loss of neurofibromin allows Ras to maintain and active conformation as evidenced by increased phosphorylation of Erk 1/2 and Akt. In a similar manner, the binding of insulin to its tyrosine kinase receptor mediates a signaling pathway that converges on Akt (predominantly Akt2) to facilitate recruitment of glucose transporters to the plasma membrane to increase uptake of extracellular glucose and turn on glycolysis. It is reasonable to conclude that loss of neurofibromin amplifies insulin signaling and maintains glucose transporters in the plasma membrane while also increasing intracellular glucose utilization. Recent work suggests a feedforward loop wherein increased glycolysis and accumulation of fructose 1,6-bisphosphate directly activates Ras-Erk signaling via enhanced binding of SOS with at least 2 Ras isoforms(40, 41). Relevant to NF1, it remains to be determined whether enhanced glucose metabolism accelerates Ras signaling or whether the activation of Ras kinases stimulates glucose metabolism. Regardless of the order of the feedforward loop, the link between glucose metabolism and Ras activation in persons with NF1 has direct implications for cancer cell proliferation and tumor growth.
We acknowledge limitations of the current study. First, we present data from a well-characterized mouse line, but these mice cannot represent all of the described mutations in the human NF1 gene. An important murine line to consider would be the Nf1Arg681 that express a single point mutation that renders the GAP properties of neurofibromin inactive. If we identified similar features in mice with heterozygous Nf1Arg681 mutations, that would strongly support that the phenotype is the result of perturbations in Ras signaling. Second, we have not assessed these features in aged mice. Persons with NF1 have a shortened lifespan of 15 years over the general population so we elected to focus on younger mice. It is possible that aged mice would show greater differences between genotypes and these findings would be informative as advances in care for persons with NF1 leads to an older population.
In conclusion, our data strongly suggests that germline mutations in Nf1 mirror the anthropometric and metabolic phenotype observed in persons with NF1 and provides a tractable platform for future studies related to the function of neurofibromin in metabolically active tissues including muscle and brain tissue. The reduction in fat depot mass and enhanced glucose utilization in Nf1+/− mice may affect the outcome or interpretation of results from Nf1+/− mice and these strong correlations between Nf1+/− mice and persons with NF1 must be accounted for in future mechanistic and therapeutic studies of NF1 pathologies.
Commentary.
Background:
Neurofibromatosis type 1 (NF1) is the most common autosomal dominant tumor predisposition syndrome affecting 1 in 3,000 persons. Despite the nearly 3,000 unique mutations identified in the NF1 tumor suppressor gene, persons with NF1 share a unique morphologic and metabolic phenotype characterized by reduced body mass index, increased insulin sensitivity, and protection from diabetes.
Translational Significance:
Nf1 heterozygous (Nf1+/−) mice are lean with enhanced glucose clearance and are protected from diet-induced obesity and hyperglycemia. These features mirror the metabolic and morphologic features of humans with NF1, which may influence the timing and type of tumor manifestations as well as response to therapy.
Acknowledgements
All authors acknowledge the journal’s conflict of interest policy and do have any conflicts of interest to disclose. All authors have read the Journal’s authorship agreement, approve the final version of the manuscript and agree to be accountable for all aspects of the reported work. All persons who qualify for authorship are listed as authors.
Sources of Funding
This work was supported by the National Institutes of Health (5R01EY029318, B.K.S.), Department of Defense (W81XWH-15-1-0228, B.K.S.) and American Heart Association (19PRE34380741, R.T. and B.K.S.).
Abbreviations:
- BMI
body mass index
- CLAMS
Comprehensive Lab Animal Monitoring System
- DXA
dual energy X-ray absorptiometry
- GAP
GTPase-activating protein
- GTT
glucose tolerance test
- HDL
high density lipoprotein
- HgbA1c
glycosylated hemoglobin
- ITT
insulin tolerance test
- IP
intraperitoneal
- LDL
low density lipoprotein
- NF1
neurofibromatosis type 1
- Nf1
neurofibromatosis type 1 gene
- Nf1+/−
heterozygous loss of Nf1 gene
- NMR
nuclear magnetic resonance
- PTT
pyruvate tolerance test
- RAS
p21Ras signaling pathway
- RER
respiratory exchange ratio
- SD
standard deviation
- SEM
standard error of mean
- VO2
volume of oxygen consumption
- VCO2
volume carbon dioxide produced
- WT
wild type
Footnotes
Publisher's Disclaimer: This is a PDF file of an unedited manuscript that has been accepted for publication. As a service to our customers we are providing this early version of the manuscript. The manuscript will undergo copyediting, typesetting, and review of the resulting proof before it is published in its final form. Please note that during the production process errors may be discovered which could affect the content, and all legal disclaimers that apply to the journal pertain.
References
- 1.Duong TA, Sbidian E, Valeyrie-Allanore L, Vialette C, Ferkal S, Hadj-Rabia S, Glorion C, Lyonnet S, Zerah M, Kemlin I et al. (2011) Mortality associated with neurofibromatosis 1: a cohort study of 1895 patients in 1980–2006 in France. Orphanet J Rare Dis, 6, 18. [DOI] [PMC free article] [PubMed] [Google Scholar]
- 2.Koczkowska M, Chen Y, Callens T, Gomes A, Sharp A, Johnson S, Hsiao MC, Chen Z, Balasubramanian M, Barnett CP et al. (2018) Genotype-Phenotype Correlation in NF1: Evidence for a More Severe Phenotype Associated with Missense Mutations Affecting NF1 Codons 844–848. Am J Hum Genet, 102, 69–87. [DOI] [PMC free article] [PubMed] [Google Scholar]
- 3.Gutmann DH, Ferner RE, Listernick RH, Korf BR, Wolters PL and Johnson KJ (2017) Neurofibromatosis type 1. Nat Rev Dis Primers, 3, 17004. [DOI] [PubMed] [Google Scholar]
- 4.Rasmussen SA, Yang Q and Friedman JM (2001) Mortality in neurofibromatosis 1: an analysis using U.S. death certificates. Am J Hum Genet, 68, 1110–1118. [DOI] [PMC free article] [PubMed] [Google Scholar]
- 5.Madubata CC, Olsen MA, Stwalley DL, Gutmann DH and Johnson KJ (2015) Neurofibromatosis type 1 and chronic neurological conditions in the United States: an administrative claims analysis. Genet Med, 17, 36–42. [DOI] [PMC free article] [PubMed] [Google Scholar]
- 6.Martins AS, Jansen AK, Rodrigues LO, Matos CM, Souza ML, de Souza JF, Diniz Mde F, Barreto SM, Diniz LM, de Rezende NA et al. (2016) Lower fasting blood glucose in neurofibromatosis type 1. Endocr Connect, 5, 28–33. [DOI] [PMC free article] [PubMed] [Google Scholar]
- 7.Martins AS, Jansen AK, Rodrigues LOC, Matos CM, Souza MLR, Miranda DM and Rezende NA (2018) Increased insulin sensitivity in individuals with neurofibromatosis type 1. Arch Endocrinol Metab, 62, 41–46. [DOI] [PMC free article] [PubMed] [Google Scholar]
- 8.Ozhan B, Ozguven AA and Ersoy B (2013) Neurofibromatosis type 1 and diabetes mellitus: an unusual association. Case Rep Endocrinol, 2013, 689107. [DOI] [PMC free article] [PubMed] [Google Scholar]
- 9.Jacks T, Shih TS, Schmitt EM, Bronson RT, Bernards A and Weinberg RA (1994) Tumour predisposition in mice heterozygous for a targeted mutation in Nf1. Nat Genet, 7, 353–361. [DOI] [PubMed] [Google Scholar]
- 10.Brannan CI, Perkins AS, Vogel KS, Ratner N, Nordlund ML, Reid SW, Buchberg AM, Jenkins NA, Parada LF and Copeland NG (1994) Targeted disruption of the neurofibromatosis type-1 gene leads to developmental abnormalities in heart and various neural crest-derived tissues. Genes Dev, 8, 1019–1029. [DOI] [PubMed] [Google Scholar]
- 11.Silva AJ, Frankland PW, Marowitz Z, Friedman E, Laszlo GS, Cioffi D, Jacks T and Bourtchuladze R (1997) A mouse model for the learning and memory deficits associated with neurofibromatosis type I. Nat Genet, 15, 281–284. [DOI] [PubMed] [Google Scholar]
- 12.Li F, Downing BD, Smiley LC, Mund JA, Distasi MR, Bessler WK, Sarchet KN, Hinds DM, Kamendulis LM, Hingtgen CM et al. (2014) Neurofibromin-deficient myeloid cells are critical mediators of aneurysm formation in vivo. Circulation, 129, 1213–1224. [DOI] [PMC free article] [PubMed] [Google Scholar]
- 13.Bessler WK, Kim G, Hudson FZ, Mund JA, Mali R, Menon K, Kapur R, Clapp DW, Ingram DA Jr. and Stansfield BK (2016) Nf1+/− monocytes/macrophages induce neointima formation via CCR2 activation. Hum Mol Genet, 25, 1129–1139. [DOI] [PMC free article] [PubMed] [Google Scholar]
- 14.Angara K, Pai EL, Bilinovich SM, Stafford AM, Nguyen JT, Li KX, Paul A, Rubenstein JL and Vogt D (2020) Nf1 deletion results in depletion of the Lhx6 transcription factor and a specific loss of parvalbumin(+) cortical interneurons. Proc Natl Acad Sci U S A, 117, 6189–6195. [DOI] [PMC free article] [PubMed] [Google Scholar]
- 15.Rhodes SD, He Y, Smith A, Jiang L, Lu Q, Mund J, Li X, Bessler W, Qian S, Dyer W et al. (2019) Cdkn2a (Arf) loss drives NF1-associated atypical neurofibroma and malignant transformation. Hum Mol Genet, 28, 2752–2762. [DOI] [PMC free article] [PubMed] [Google Scholar]
- 16.Ferrer M, Gosline SJC, Stathis M, Zhang X, Guo X, Guha R, Ryman DA, Wallace MR, Kasch-Semenza L, Hao H et al. (2018) Pharmacological and genomic profiling of neurofibromatosis type 1 plexiform neurofibroma-derived schwann cells. Sci Data, 5, 180106. [DOI] [PMC free article] [PubMed] [Google Scholar]
- 17.Lasater EA, Li F, Bessler WK, Estes ML, Vemula S, Hingtgen CM, Dinauer MC, Kapur R, Conway SJ and Ingram DA Jr. (2010) Genetic and cellular evidence of vascular inflammation in neurofibromin-deficient mice and humans. J Clin Invest, 120, 859–870. [DOI] [PMC free article] [PubMed] [Google Scholar]
- 18.Butcher JT, Ali MI, Ma MW, McCarthy CG, Islam BN, Fox LG, Mintz JD, Larion S, Fulton DJ and Stepp DW (2017) Effect of myostatin deletion on cardiac and microvascular function. Physiol Rep, 5. [DOI] [PMC free article] [PubMed] [Google Scholar]
- 19.Chatterjee TK, Basford JE, Knoll E, Tong WS, Blanco V, Blomkalns AL, Rudich S, Lentsch AB, Hui DY and Weintraub NL (2014) HDAC9 knockout mice are protected from adipose tissue dysfunction and systemic metabolic disease during high-fat feeding. Diabetes, 63, 176–187. [DOI] [PMC free article] [PubMed] [Google Scholar]
- 20.Hofmann SM, Zhou L, Perez-Tilve D, Greer T, Grant E, Wancata L, Thomas A, Pfluger PT, Basford JE, Gilham D et al. (2007) Adipocyte LDL receptor-related protein-1 expression modulates postprandial lipid transport and glucose homeostasis in mice. J Clin Invest, 117, 3271–3282. [DOI] [PMC free article] [PubMed] [Google Scholar]
- 21.Souza M, Jansen A, Martins A, Rodrigues L and Rezende N (2016) Body composition in adults with neurofibromatosis type 1. Rev Assoc Med Bras (1992), 62, 831–836. [DOI] [PubMed] [Google Scholar]
- 22.Souza MLR, Jansen AK, Rodrigues LOC, Vilela DLS, Kakehasi AM, Martins AS, Souza JF and Rezende NA (2019) Increased resting metabolism in neurofibromatosis type 1. Clin Nutr ESPEN, 32, 44–49. [DOI] [PubMed] [Google Scholar]
- 23.Summers MA, Rupasinghe T, Vasiljevski ER, Evesson FJ, Mikulec K, Peacock L, Quinlan KG, Cooper ST, Roessner U, Stevenson DA et al. (2018) Dietary intervention rescues myopathy associated with neurofibromatosis type 1. Hum Mol Genet, 27, 577–588. [DOI] [PubMed] [Google Scholar]
- 24.Ratner N and Miller SJ (2015) A RASopathy gene commonly mutated in cancer: the neurofibromatosis type 1 tumour suppressor. Nat Rev Cancer, 15, 290–301. [DOI] [PMC free article] [PubMed] [Google Scholar]
- 25.Da Costa LA, Arora P, Garcia-Bailo B, Karmali M, El-Sohemy A and Badawi A (2012) The association between obesity, cardiometabolic disease biomarkers, and innate immunity-related inflammation in Canadian adults. Diabetes Metab Syndr Obes, 5, 347–355. [DOI] [PMC free article] [PubMed] [Google Scholar]
- 26.Wittenbecher C, Kuxhaus O, Boeing H, Stefan N and Schulze MB (2019) Associations of short stature and components of height with incidence of type 2 diabetes: mediating effects of cardiometabolic risk factors. Diabetologia, 62, 2211–2221. [DOI] [PMC free article] [PubMed] [Google Scholar]
- 27.Kenborg L, Duun-Henriksen AK, Dalton SO, Bidstrup PE, Doser K, Rugbjerg K, Pedersen C, Kroyer A, Johansen C, Andersen KK et al. (2020) Multisystem burden of neurofibromatosis 1 in Denmark: registry- and population-based rates of hospitalizations over the life span. Genet Med, in press. [DOI] [PubMed] [Google Scholar]
- 28.Tu YK, Gunnell D and Gilthorpe MS (2008) Simpson’s Paradox, Lord’s Paradox, and Suppression Effects are the same phenomenon--the reversal paradox. Emerg Themes Epidemiol, 5, 2. [DOI] [PMC free article] [PubMed] [Google Scholar]
- 29.Halldorsdottir S, Carmody J, Boozer CN, Leduc CA and Leibel RL (2009) Reproducibility and accuracy of body composition assessments in mice by dual energy x-ray absorptiometry and time domain nuclear magnetic resonance. Int J Body Compos Res, 7, 147–154. [PMC free article] [PubMed] [Google Scholar]
- 30.Smith SR, Lovejoy JC, Greenway F, Ryan D, deJonge L, de la Bretonne J, Volafova J and Bray GA (2001) Contributions of total body fat, abdominal subcutaneous adipose tissue compartments, and visceral adipose tissue to the metabolic complications of obesity. Metabolism: clinical and experimental, 50, 425–435. [DOI] [PubMed] [Google Scholar]
- 31.Chusyd DE, Wang D, Huffman DM and Nagy TR (2016) Relationships between Rodent White Adipose Fat Pads and Human White Adipose Fat Depots. Front Nutr, 3, 10. [DOI] [PMC free article] [PubMed] [Google Scholar]
- 32.Weber RV, Buckley MC, Fried SK and Kral JG (2000) Subcutaneous lipectomy causes a metabolic syndrome in hamsters. Am J Physiol Regul Integr Comp Physiol, 279, R936–943. [DOI] [PubMed] [Google Scholar]
- 33.de Souza ML, Jansen AK, Martins AS, Rodrigues LO and de Rezende NA (2015) Nutrient intake in neurofibromatosis type 1: A cross-sectional study. Nutrition, 31, 858–862. [DOI] [PubMed] [Google Scholar]
- 34.Carroll MD, Kruszon-Moran D and Tolliver E (2019) Trends in Apolipoprotein B, Non-high-density Lipoprotein Cholesterol, and Low-density Lipoprotein Cholesterol for Adults Aged 20 and Over, 2005–2016. Natl Health Stat Report, in press, 1–16. [PubMed] [Google Scholar]
- 35.Softic S, Gupta MK, Wang GX, Fujisaka S, O’Neill BT, Rao TN, Willoughby J, Harbison C, Fitzgerald K, Ilkayeva O et al. (2017) Divergent effects of glucose and fructose on hepatic lipogenesis and insulin signaling. J Clin Invest, 127, 4059–4074. [DOI] [PMC free article] [PubMed] [Google Scholar]
- 36.Cozzo AJ, Fuller AM and Makowski L (2017) Contribution of Adipose Tissue to Development of Cancer. Compr Physiol, 8, 237–282. [DOI] [PMC free article] [PubMed] [Google Scholar]
- 37.Rozza-de-Menezes RE, Brum CAI, Gaglionone NC, de Sousa Almeida LM, Andrade-Losso RM, Paiva BVB, Faveret PLS, da Silva AV, Siqueira OHK, Riccardi VM et al. (2018) Prevalence and clinicopathological characteristics of lipomatous neurofibromas in neurofibromatosis 1: An investigation of 229 cutaneous neurofibromas and a systematic review of the literature. J Cutan Pathol, 45, 743–753. [DOI] [PubMed] [Google Scholar]
- 38.Le LQ and Parada LF (2007) Tumor microenvironment and neurofibromatosis type I: connecting the GAPs. Oncogene, 26, 4609–4616. [DOI] [PMC free article] [PubMed] [Google Scholar]
- 39.Garofalo C and Surmacz E (2006) Leptin and cancer. Journal of cellular physiology, 207, 12–22. [DOI] [PubMed] [Google Scholar]
- 40.Peeters K, Van Leemputte F, Fischer B, Bonini BM, Quezada H, Tsytlonok M, Haesen D, Vanthienen W, Bernardes N, Gonzalez-Blas CB et al. (2017) Fructose-1,6-bisphosphate couples glycolytic flux to activation of Ras. Nat Commun, 8, 922. [DOI] [PMC free article] [PubMed] [Google Scholar]
- 41.White E (2013) Exploiting the bad eating habits of Ras-driven cancers. Genes Dev, 27, 2065–2071. [DOI] [PMC free article] [PubMed] [Google Scholar]