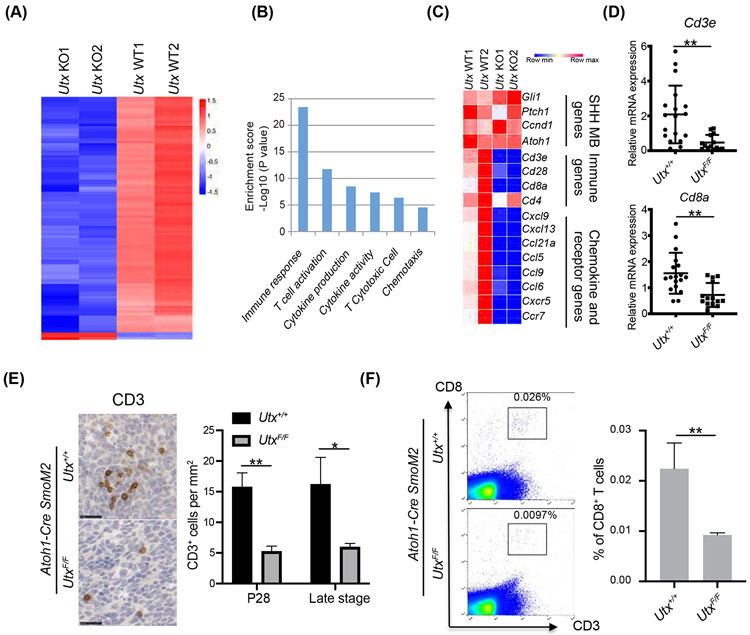
Figure 2. UTX deletion in medulloblastoma led to decreased T cell numbers in the tumor environment.
A. Heatmap of RNA-seq results shows that the majority of differentially expressed genes were downregulated in UTX-deleted SmoM2 tumors compared to wildtype tumors (n=2 per group).
B. Gene ontology analysis shows genes involved in immune response was overrepresented in UTX regulated genes.
C. Heatmap of examples of SHH medulloblastoma specific genes, immune genes, chemokine, and chemokine receptor genes in the RNA-seq tumor samples.
D. RT-qPCR confirmation of T cell markers in RNA-seq data using tumor samples (n=18 for Utx+/+ tumors and n=14 for UtxF/F tumors).
E. (Left) Representative IHC images of CD3 staining of medulloblastoma sections at P28. (Right) Quantification of CD3 cells by IHC staining (P28, n=5 for Utx+/+ tumor and n=3 for UtxF/F tumor) and later tumor stage (n=4 for Utx+/+ tumor and n=3 for UtxF/F tumor).
F. (Left) Representative flow cytometry images of CD3 and CD8 staining at late tumor stage. (Right) Flow cytometric quantification of CD8+ T cells (n=5).
Student’s t-test, *, p<0.05; **, p<0.01.

