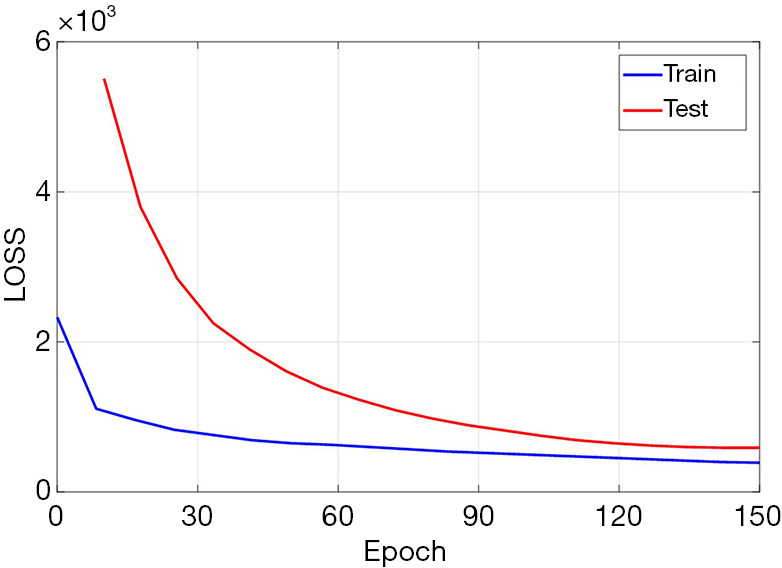
Figure 5.

The convergence curve of the loss curve between the reconstructed image and the real image. The loss curve of the training set is shown in blue, and the loss curve of the test set is shown in red. The test set loss curve stops decreasing at approximately 150 epochs.
