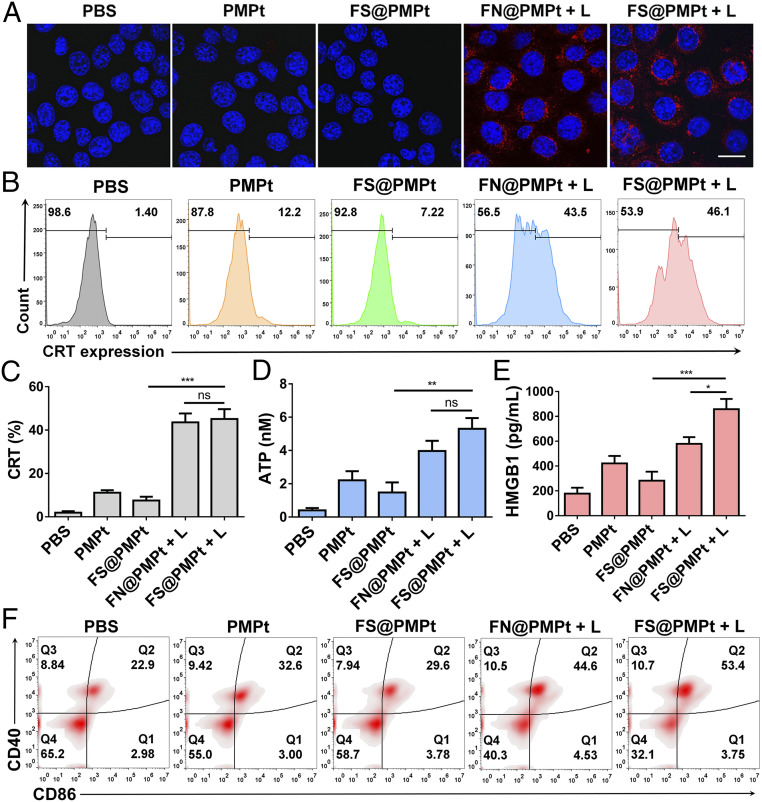
Fig. 4.
Immune activation in vitro. (A) Confocal images of CRT exposure in 4T1 cells after different treatments with the nanoclusters. (B) Flow cytometry assay and (C) data analysis of the CRT expression in 4T1 cells after different treatments with the nanoclusters. (D) ATP and (E) HMGB1 in the cell supernatant detected by the ATP assay kit and enzyme-linked immunosorbent assay (ELISA). Results are shown as mean ± SD (n = 3); P values were calculated by Student’s t test, *P < 0.05, **P < 0.01, ***P < 0.001, ns = no significant difference. (F) In vitro DC maturation (CD40+CD86+) detected by the flow cytometry assay after cocultured with 4T1 cells with different treatments.

